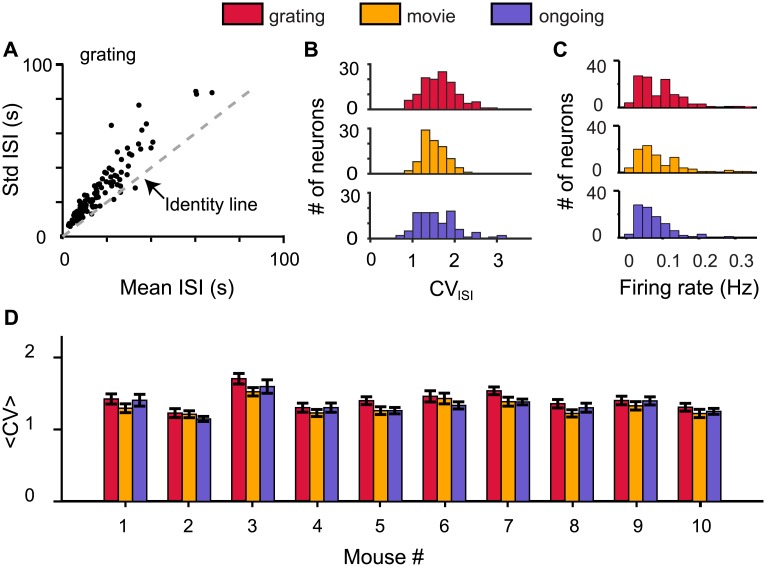
Fig 5. Irregular spiking at network criticality.
(A) The standard deviation (Std) of the inter spike intervals (ISIs) was larger than the mean ISI for most neurons (black dots) for mouse #3 (grating). (B) The ISI coefficient of variation (CVISI) distributions for the recorded neurons from mouse #3 under three stimulus conditions. (C) The firing rate distributions for the recorded neurons from mouse #3 under three stimulus conditions. (D) The average coefficient of variation 〈CV〉 (mean ± SEM) for all 10 mice and three stimulus conditions tested.

