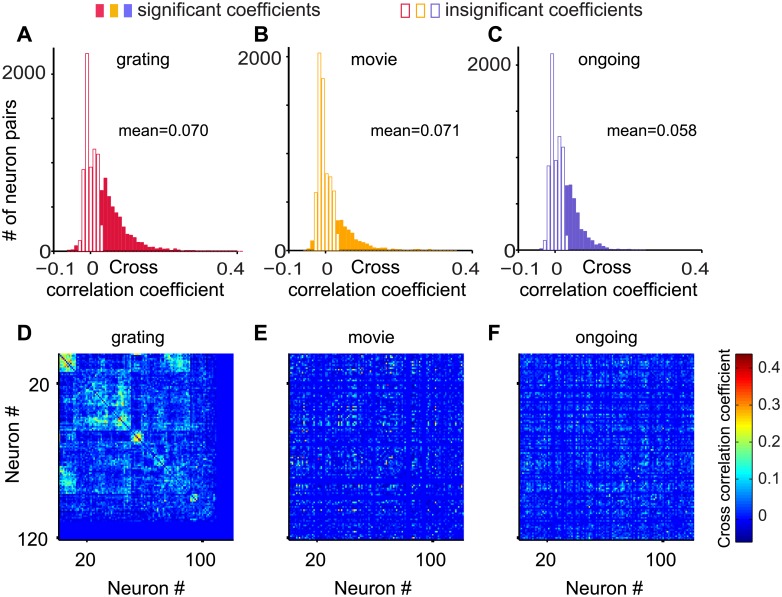
Fig 6. The cross-correlation coefficients among the pairs of neurons rearrange for different stimulus conditions.
(A-C) The distributions of the zero-lag pairwise Pearson cross-correlation coefficients of the thresholded inferred spike probabilities for the three stimulus conditions. Significance testing was obtained by comparing with uncorrelated spike trains of the same mean rate and adopting a p-value threshold of 0.1. (D) The cross-correlation coefficient matrix for the grating stimulus, with the matrix clustered using a hierarchical clustering algorithm (see Materials and methods). A subset of rows/columns are blank because neurons with noisy signal with no apparent calcium transient for a give stimulus condition were detected by visual inspection and excluded from further analysis for that stimulus condition. (E, F) The cross-correlation coefficient matrix for the other two stimulus conditions (movie, ongoing), while maintaining the order of neurons as in (D). This display illustrates the reorganization of the cross-correlation when varying the stimulus condition.

