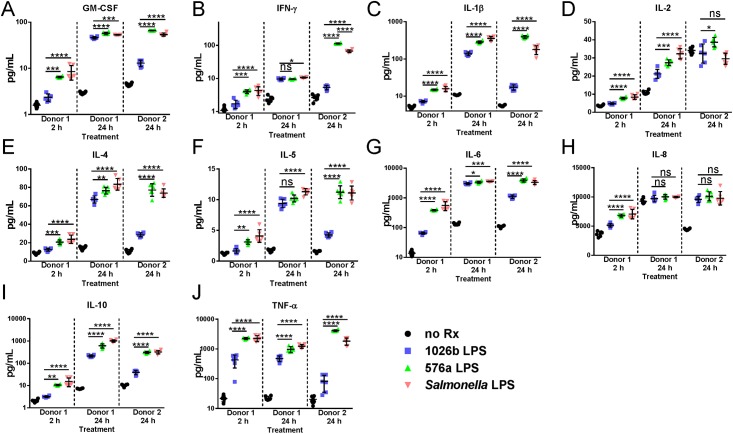
Fig 6. Cytokine secretion by human PBMCs in response to treatment with B. pseudomallei LPS.
Levels of cytokines secreted by human PBMCs were measured at 2 and 24 h post LPS treatment for Donor 1 and 24 h post treatment from Donor 2. The cytokines analyzed are indicated above each plot with the sample origins indicated on the X-axis. Data for each sample set are divided by a dashed line. Mock treated negative control replicates are indicated by black circles, data obtained for Type A (1026b) LPS treatment are indicated by blue squares, and data obtained for Type B (576a) LPS treatment are indicated by green triangles. Salmon-colored triangles indicate data from positive control S. minnesota S-LPS treated samples. A), GM-CSF; B), IFN-γ; C), IL-1β; D), IL-2; E), IL-4; F), IL-5; G), IL-6; H), IL-8; I), IL-10; J), TNF-α. Scales are either linear or log depending on the cytokine for clarity. The means of all replicates and standard error of the means are indicated by error bars and lines. Differences between 576a compared to 1026b and Salmonella compared to 1026b treated were significant as determined by multiple one-way ANOVAs as shown above the datasets. ns = not significant, * = p<0.05, ** = p<0.005, *** = p<0.0005, **** = p<0.0001.

