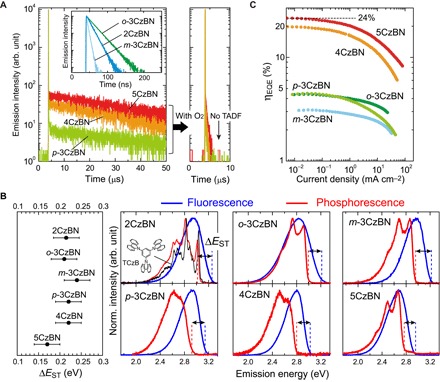
Fig. 2. Photophysical characteristics.

(A) PL decay curves of 2CzBN, o-3CzBN, m-3CzBN, p-3CzBN, 4CzBN, and 5CzBN in toluene at 295 K. 2CzBN, o-3CzBN, and m-3CzBN showed only prompt fluorescence, whereas p-3CzBN, 4CzBN, and 5CzBN exhibited prompt and delayed fluorescence (TADF). Right: Disappearance of TADF due to deactivation of T states caused by O2. (B) ΔEST with an error of ±0.03 eV of CzBN derivatives, estimated from the threshold energy difference between the fluorescence and phosphorescence spectra (77 K) for each molecule (right). Note that only the energy of the phosphorescence spectrum of 2CzBN was chosen from a first peak top (0-0 peak). For 2CzBN, the phosphorescence spectrum of TCzB (black) is also shown to display the spectral similarities with 2CzBN. Inset: Chemical structure of TCzB. (C) ηEQE as a function of current density for OLEDs [ITO/TAPC (35 nm)/mCP (10 nm)/dopant (15 wt %):PPT (30 nm)/PPT (40 nm)/LiF (0.8 nm)/Al (100 nm)] containing o-3CzBN (green), m-3CzBN (light blue), p-3CzBN (light green), 4CzBN (light brown), and 5CzBN (red) as the emitter dopant.
