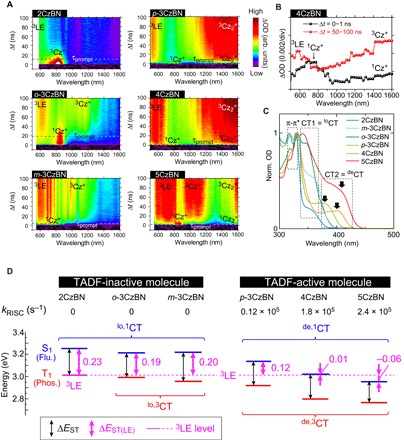
Fig. 4. RISC mechanism of TADF-active molecules.

(A) Contour maps of nanosecond-TAS results of 2CzBN, o-3CzBN, m-3CzBN, p-3CzBN, 4CzBN, and 5CzBN in toluene. (B) TAS spectra of the S (Δt = 0 to 1 ns) and T (Δt = 50 to 100 ns) states of 4CzBN. ΔOD is averaged one in each time range. (C) Ground-state absorption spectra of the CzBN derivatives in toluene. (D) Relation between kRISC and ΔEST(LE) of TADF-inactive (left) and TADF-active (right) molecules in energy-level diagram, respectively. Flu., fluorescence; Phos., phosphorescence.
