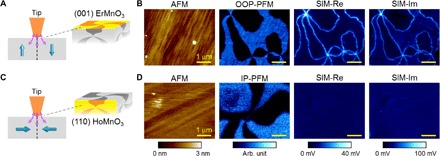
Fig. 2. SIM experiments on other h-RMnO3.

(A) Schematic representation of the tip electric fields (pink) and the OOP polarization (blue) on the highlighted (001) ErMnO3 surface. (B) AFM, OOP-PFM, SIM-Re, and SIM-Im (f = 1 GHz) images acquired on (001) ErMnO3. Clear DW contrast can be seen in the SIM data. (C) and (D) are the same as (A) and (B), except that the schematic and the data are for (110) HoMnO3, showing clear domain contrast in the in-plane (IP) PFM but no DW contrast in the SIM images. Scale bars, 1 μm.
