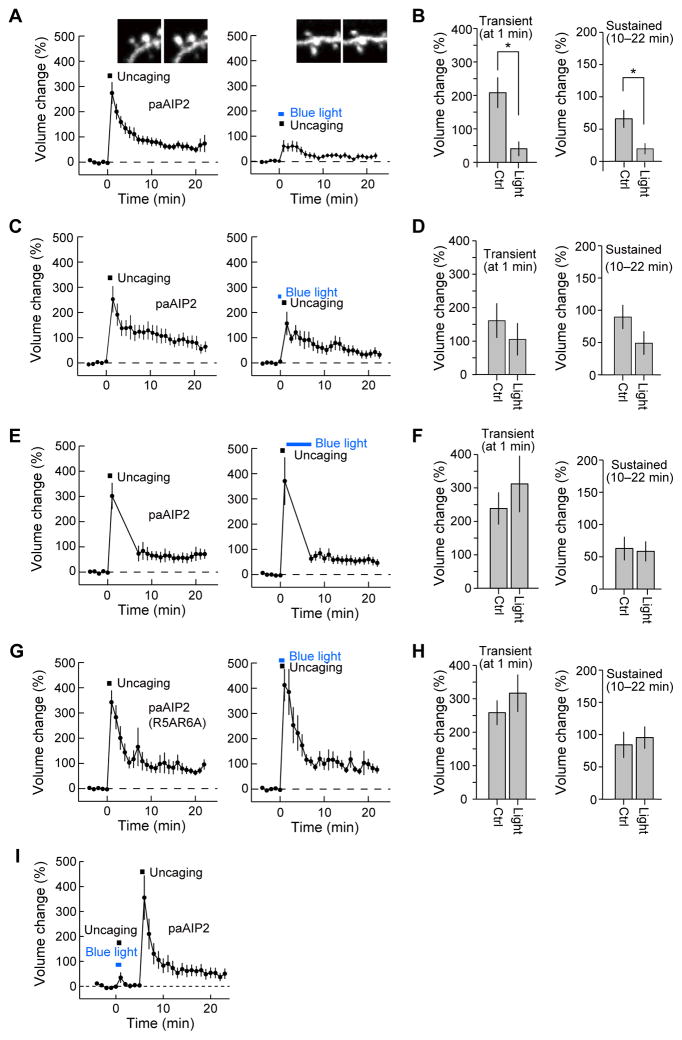
Fig. 4. PaAIP2 inhibits spine enlargement in a light-dependent manner.
A, C, E, G, I, Averaged time course of spine volume change induced with 2-photon glutamate uncaging (0.5 Hz, 30 pulses) in neurons expressing mEGFP-P2A-mCherry-P2A-paAIP2 (A, C, E, I) or its mutant (R5A/R6A) (G). Fluorescence intensity of mEGFP was used to measure the spine volume change in the stimulated spine. Experiments with (right panels) and without (left panels) blue light were performed in the same neurons. The numbers of samples (spines/neurons) are 14/10 (A, B), 12/12 (C, D), 12/9 (E, F), 12/8 (G, H) and 9/5 (I).
B, D, F, H. Transient volume change (volume change averaged over 1 min subtracted by that averaged over 10–22 min) and sustained volume change (volume change averaged over 10–22 min). For B, D, F, and H, bar graphs represent summarized data from A, C, E, and G, respectively. Stars denote statistical significance (p < 0.05, paired t-test).
See also Figure S3.

