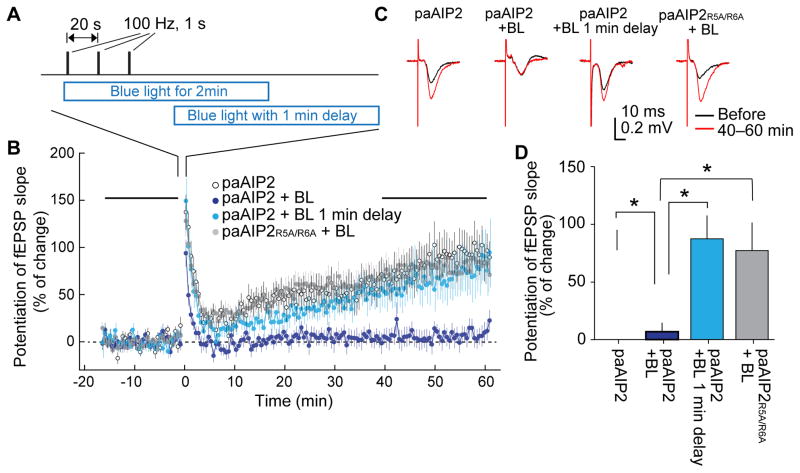
Fig. 6. Inhibition of field LTP in acute hippocampal slices.
A. LTP induction protocol and the timing of blue light illumination (35 mW/cm2).
B. Averaged time course of field excitatory postsynaptic potential (fEPSP) slope measured with an electrode located at CA1 dendritic layer while stimulating Schaffer-Collateral fibers with a bipolar electrode. LTP was induced with the protocol in A at time zero. Blue light (BL) was applied as indicated in A.
C. Representative traces of fEPSP.
D. Quantification of LTP at 50–60 min after LTP induction. Stars denote statistical significance (p < 0.05, nonparametric one-way ANOVA followed by post-hoc tests using the Tukey’s least significant difference). Numbers of neurons/animals are: 21/19, 12/11, 18/12, 36/13 for paAIP2 without light, paAIP2 with blue light illumination, paAIP2 with blue light illumination with 1 min delay, and paAIP2R5A/R6A with blue light illumination, respectively.

