Abstract
Objective This study aims to compare the accuracy of visual, quantitative gravimetric, and colorimetric methods used to determine blood loss during cesarean delivery procedures employing a hemoglobin extraction assay as the reference standard.
Study Design In 50 patients having cesarean deliveries blood loss determined by assays of hemoglobin content on surgical sponges and in suction canisters was compared with obstetricians' visual estimates, a quantitative gravimetric method, and the blood loss determined by a novel colorimetric system. Agreement between the reference assay and other measures was evaluated by the Bland–Altman method.
Results Compared with the blood loss measured by the reference assay (470 ± 296 mL), the colorimetric system (572 ± 334 mL) was more accurate than either visual estimation (928 ± 261 mL) or gravimetric measurement (822 ± 489 mL). The correlation between the assay method and the colorimetric system was more predictive (standardized coefficient = 0.951, adjusted R2 = 0.902) than either visual estimation (standardized coefficient = 0.700, adjusted R2 = 00.479) or the gravimetric determination (standardized coefficient = 0.564, adjusted R2 = 0.304).
Conclusion During cesarean delivery, measuring blood loss using colorimetric image analysis is superior to visual estimation and a gravimetric method. Implementation of colorimetric analysis may enhance the ability of management protocols to improve clinical outcomes.
Keywords: cesarean delivery, blood loss measurement, postpartum hemorrhage, quality improvement
Obstetrical hemorrhage is a potentially preventable cause of maternal morbidity and mortality, and its incidence is steadily increasing.1 2 Standardized approaches are being adopted to improve the care of these patients.3 4 Since poor outcomes can result from both delayed recognition and denial of the occurrence of significant bleeding3 and changes in maternal vital signs or laboratory parameters often provide late or misleading information,5 6 7 effective measurement of ongoing blood loss is critical to early recognition.
Existing techniques for determining cumulative blood loss during cesarean procedures include visual estimation and a gravimetric method that involves weighing of soiled sponges and measurement of fluid in suction canisters. Since visual estimation frequently either over or underestimates the amount of bleeding8 9 and requires continual retraining and constant vigilance during surgery,10 national organizations such as California Maternal Quality Care Collaborative (CMQCC), the Association of Women's Health, Obstetric and Neonatal Nurses (AWHONN), and the Council on Patient Safety in Women's Healthcare recommend weighing sponges to quantify blood loss. While this gravimetric method focuses providers on the importance of quantitatively assessing blood loss, it is cumbersome and has mixed data to validate its accuracy.11 12
The Triton system (Gauss Surgical, Inc., Los Altos, CA) is a novel U.S. Food and Drug Administration-cleared mobile application on a tablet computer (iPad) that uses the enabled tablet camera to capture images of surgical sponges. It performs colorimetric image correction and analysis and uses cloud-based machine-learning models to quantify hemoglobin (Hgb) mass on surgical sponges in real time. The technology can also be used to measure the Hgb content of fluid collected in suction canisters during surgery and is accurate despite dilution with amniotic or other fluids. The performance of the device has been validated in bench-top and clinical settings.13 14 15
The objective of this study was to evaluate and compare the accuracy of visual estimation, quantitative gravimetric and colorimetric methods in determining cumulative blood loss during cesarean delivery procedures using a validated Hgb extraction assay method as the reference standard.
Materials and Methods
The protocol was approved by the Santa Clara Valley Medical Center Institutional Review Board (San Jose, CA) reference #12–003; August 12, 2013. Canister and sponge samples from 50 consecutive patients having cesarean deliveries on weekdays between October and December 2015 were studied, and relevant patient and procedural information were collected and deidentified. Patients with known human immunodeficiency virus, hepatitis B virus or hepatitis C virus, were excluded. Standard methods of care were used throughout the procedures including fluid administration and the use and management of surgical sponges (RFDetect L1818–04P01C-1 18”×18”, RF Surgical Systems, Inc.) and suction canisters (Medi-Vac Guardian™ 65651–230 3000 mL, Cardinal Health, Inc.). Soiled laparotomy sponges were individually stored in sponge counting bags, and suction canisters were affixed with a label for recording amniotic and irrigation fluid volumes. Preprocedure and postoperative day 1 Hgb values (g/dL) and all blood product transfusions given in the operating room were documented. Clinicians used only visually estimated blood loss (EBL) in making patient management decisions; they were blinded to results of the other assays.
For each patient, the cumulative blood loss was calculated from direct extraction assays of Hgb content on surgical sponges and in suction canisters. This result was compared with the attending obstetrician's visual estimate of blood loss, the measured blood loss using a quantitative gravimetric method and the blood loss determined by the colorimetric system.
Extraction assay: The Hgb recovery process draws from previously published methodology.16 17 18 19 20 Upon completion of each procedure, all soiled laparotomy sponges, and suction canisters were transferred to an on-site benchtop facility for Hgb extraction. Sponges were individually soaked in 400 mL of normal saline, compressed by hand for 60 seconds to a mean weight of 50 g. This process was repeated four times. Hemoglobin concentration of the final extraction fluid was measured using the plasma/low spectrophotometer (HemoCue AB, Ängelholm, Sweden) and incorporated into the following formula to determine the total Hgb content of the sponge:
 |
where mfluid represents the mass of the extraction fluid, mresidual the mass of the fully extracted sponge, mdry the average dry weight of the sponge, ρ the density of the extraction fluid approximated as 1.0 g/mL, [Hgb]fluid the Hgb concentration of extraction fluid, and %yield the yield of the manual rinse extraction method. The yield was independently characterized by depositing banked blood on sponges in known quantities and performing the same mechanical extraction. A linear regression analysis revealed mean mHgb recovery rates of 89.5% (95% confidence interval [CI] = 86.8–92.1%) for individual sponges (n = 116).
Canister Hgb was determined by gently remixing the effluent, and transferring a 10 mL aliquot into a centrifuge tube. Two samples were drawn from the tube and measured using the plasma/low spectrophotometer for canisters ranging from 0 to 2.00 g/dL, or Hb201+ (HemoCue AB) for samples ranging from 2.0 to 25.6 g/dL, per instrument guidelines.
The canister fluid mass was measured using the digital scale, with an approximated density conversion of 1.0 g/mL:
 |
where meffluent represents the mass of the canister fluid, ρ its density, and [Hgb]effluent the Hgb concentration averaged over two samples.
The Hgb concentration in the canisters was separately assayed by using either a whole blood or low-concentration Hgb analyzer and converted to a canister blood volume first by converting the blood concentration (g/dL) of the canister to Hgb mass (g) by multiplying by the known total fluid volume in the canister, and then by dividing this canister Hgb mass (g) by the patient's baseline Hgb concentration (g/dL). All blood loss measurements (mL) were calculated by dividing Hgb mass readings by the patient's baseline (preoperative) Hgb value (g/dL). The blood loss in the canisters was then combined with the blood loss from the sponges to give a total assayed blood loss.
Visually EBL: At the conclusion of the procedure, the attending obstetrician visually estimated total blood loss based on examination of the surgical sponges and suction canisters, knowledge of the procedural specifics, and his or her estimate of the amount of amniotic fluid. The results were recorded independently, and the providers were blinded to the results of gravimetric, colorimetric or reference assay measurements to prevent confounding.
Quantitative blood loss (QBLGrav): Quantitative gravimetric measurement methods were adopted from published guidelines.3 At the time of the uterine incision, the surgical technician or nurse recorded the canister volume using the graduated markings. After aspirating all of the amniotic fluid, a second measurement was made, and the difference was recorded as the estimated amniotic fluid volume. At the conclusion of the procedure, the surgical technician recorded the total amount of irrigation fluid used. Immediately following the case, all sponges and suction canisters were individually weighed using a calibrated digital scale (A&D Co. Ltd., Tokyo, Japan). Dry sponge weights were determined by weighing three packs of five sponges each before the study (mean = 21 g, standard deviation [SD] = 0.96 g) and premeasured canister weights were subtracted. To determine the total QBLGrav estimate, all individual sponge and canister QBLGrav measurements were tallied, and the amount of amniotic and irrigation fluid used was subtracted. The sponge fluid weight was expressed as a blood volume using a 1.0 g/mL mean density conversion.
 |
 |
 |
where mwet represents the mass of a soiled sponge, VspongeQBL the gravimetric blood volume estimate on a sponge, VcanisterQBL the gravimetric blood volume estimate in a canister, Vamniotic the amniotic fluid volume estimate, and Virrigation the measured amount of irrigation fluid.
Colorimetric: Following the case, all surgical sponges were collected and scanned using the Triton sponge application (Version 2.0.9). This resulted in a measured amount of Hgb loss per sponge (g) that was converted to a volumetric measure based on the patient's preprocedure Hgb value (g/dL). Also, the surgical canisters used to collect blood and fluid from the operative field were scanned using the Triton canister application (Version 1.0.37–61), and the concentration of Hgb in the canisters was determined. This concentration was multiplied by the volume of fluid in the canister, and the resultant total Hgb in the canister was converted to a volumetric measurement of blood loss based on the patient's preprocedure Hgb value.
Statistical Analysis
Variables are expressed in mean ± SD, median/interquartile range or count (%) as appropriate. Kolmogorov–Smirnov test was used to evaluate whether the continuous variables followed a normal distribution. For parameter estimates, 95% CIs are provided. Additional analyses were performed using t-test, Mann–Whitney U test, Wilcoxon signed ranks test, and Pearson or Spearman correlations as appropriate. Volumetric blood loss measurement using the extraction assay and the other measurements (EBL, QBLGrav, and colorimetric) were compared using a two-sided paired t-test.
Agreement between the extraction assay and other measurements (EBL, QBLGrav, and colorimetric) was evaluated using the Bland–Altman method, an analysis framework that has been widely established as the standard for the comparison of the clinical differences between two different measurement methods.21 The Bland–Altman bias (mean the difference between the two measures) and upper and lower limits of agreement (mean ± 1.96 × SD) with their respective 95% CIs were computed.
As in previous studies, an acceptance criterion of ± 30 g of Hgb per case was set a priori as the clinically acceptable maximum bias.22 This difference represents approximately 5% of the total blood volume of an average adult (Hgb content of ~250 mL [approximately 1/2 unit] of whole blood). Prior studies with Triton13 14 15 indicated that the SD of the Hgb mass bias was relatively low (∼10 g or less) compared with the acceptance criterion (± 30 g), and therefore a sample size of 50 cases was deemed adequate as it provided a 95% CI of ± 0.5 × SD (approximately ± 5 g) around the limits of agreement.23 This sample size would allow 90% certainty that the limits of a two-sided 95% CI will exclude a bias of 7.25 × SD if there were truly no difference between the two measurement methods. Statistical analyses were performed using SPSS (version 13.0, SPSS, Inc.).
Results
Data were successfully collected from all 50 cases. Mean pre- and postoperative Hgb levels were 12.2 ± 1.0 and 10.8 ± 1.2 g/dL, respectively (p < 0.001 for the paired comparison of pre- and postoperative Hgb levels). One patient received a single unit packed red cell transfusion intraoperatively.
The mean patient age was 31.9 years (range = 19–44 years). Overall, 44 mothers were multiparas. All babies were singleton. A total of 41 procedures were elective. The indications for delivery included 32 elective repeat deliveries, eight breech presentations, and the remainder for a variety of other reasons. Six mothers labored before delivery although all had intact membranes. Gestational ages ranged from 31 to 41 weeks and one day with 38 being 39 weeks or greater.
The mean amniotic fluid volume as recorded intraoperatively by marking the suction canister for volumetric assessment was 632 ± 507 mL (median = 500 mL, Fig. 1) and the mean measured irrigation fluid volume was 759 ± 437 mL. As measured by the assay the mean amount of blood contained in a laparotomy sponge was 24.5 ± 20.3 mL, and the average canister contained 236 ± 137 mL of blood (Fig. 2). An average of 15 sponges and one canister were used for each procedure. The mean blood loss per procedure as measured by the assay was 470 ± 296 mL (range = 113–1,614 mL). In four cases, the total blood loss exceeded 1,000 mL (Fig. 3).
Fig. 1.
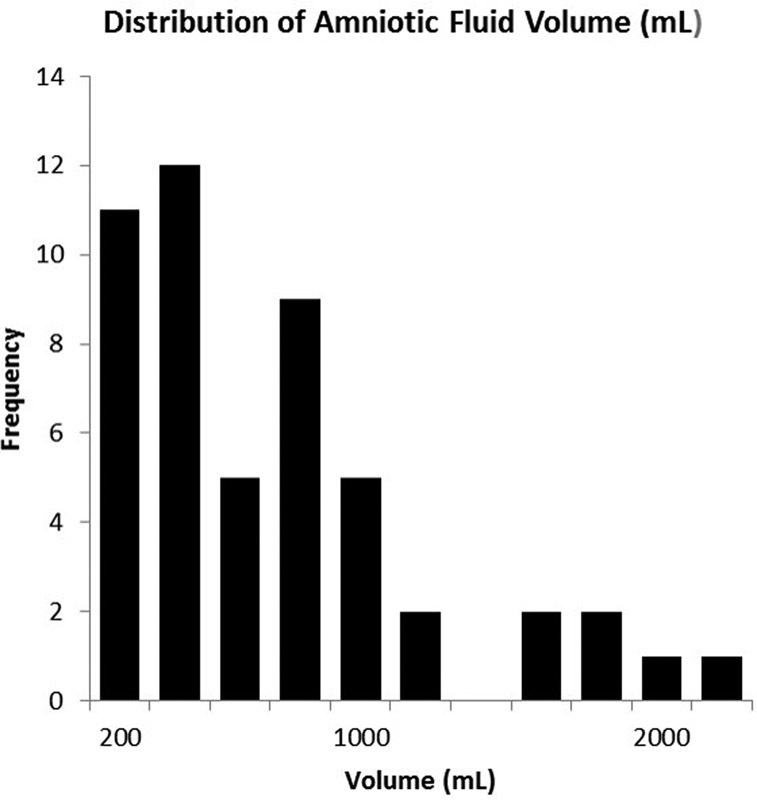
Distribution of amniotic fluid volume recorded by marking the suction canister for volumetric assessment.
Fig. 2.
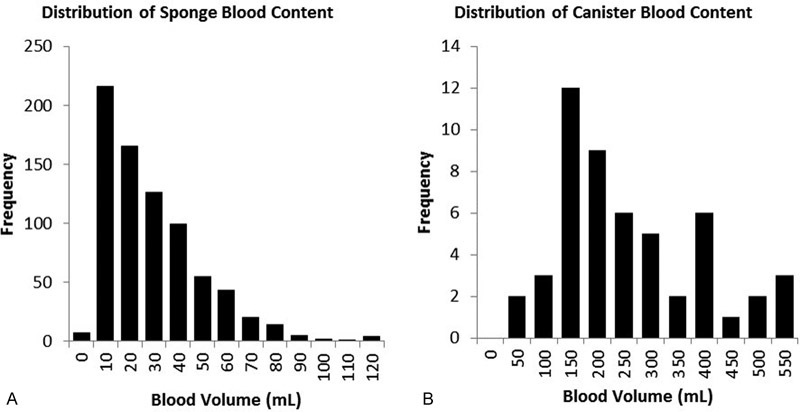
(A) Distribution of sponge blood content as measured by the assay method. (B) Distribution of canister blood content as measured by the assay method.
Fig. 3.
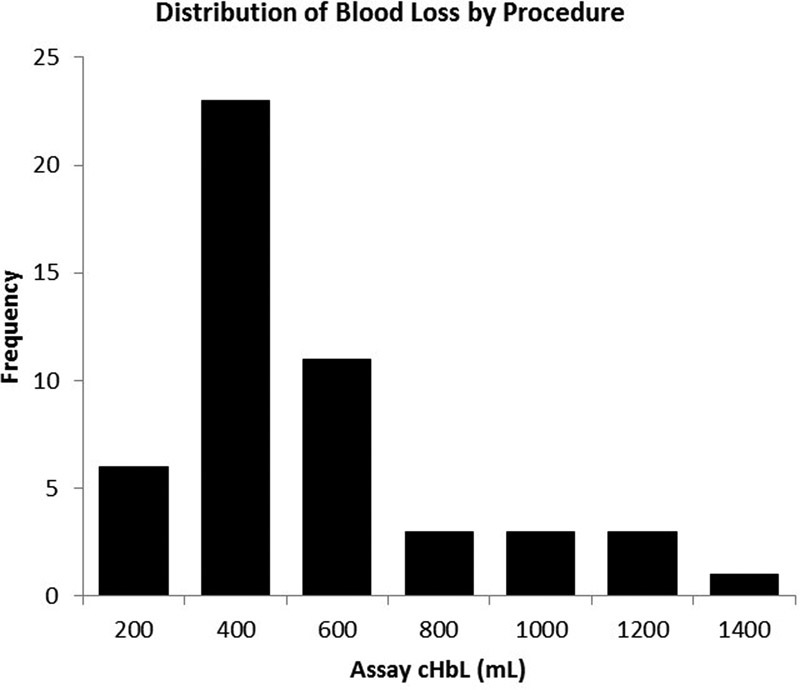
Distribution of blood loss as determined by the assay method.
The visual, gravimetric, and colorimetric methods of estimating blood loss all demonstrated positive bias (mean difference between two methods of measurement) about the extraction assay, at 458, 352, and 102 mL, respectively. Both the visual and gravimetric methods systematically overestimated blood loss more than the clinical tolerance of 1/2 a unit of whole blood, or 250 mL (Table 1).
Table 1. Blood loss determinations.
| Method | Extraction Assay | Visual EBL | QBLGrav (adjusted)a | Colorimetric | |
|---|---|---|---|---|---|
| Sponge (mL) | Mean ± SD | 280 ± 222 | 759 ± 317 | 332 ± 255 | |
| Median (IQR) | 203 (138) | 695 (426) | 251 (181) | ||
| Bias (95% CI) | 480 (428–531) | 52 (32–71) | |||
| p Value | < 0.001 | < 0.001 | |||
| Canister (mL) | Mean ± SD | 190 ± 133 | 63 ± 335 | 240 ± 137 | |
| Median (IQR) | 142 (173) | −13 (285) | 199 (202) | ||
| Bias (95% CI) | −127 (−228 to −26) | 50 (26–74) | |||
| p Value | 0.014 | < 0.001 | |||
| Total blood loss per procedure (mL) | Mean ± SD | 470 ± 296 | 928 ± 261 | 822 ± 489 | 572 ± 334 |
| Median (IQR) | 384 (296) | 800 (200) | 651 (475) | 481 (332) | |
| Bias (95% CI) | 458 (396–520) | 352 (237–467) | 102 (72–132) | ||
| p Value | < 0.001 | < 0.001 | < 0.001 |
Abbreviations: CI, confidence interval; EBL, estimated blood loss; IQR, interquartile range; QBLGrav, quantitative blood loss; SD, standard deviation.
Adjusted by subtracting the measured amniotic fluid volume and irrigation volume.
Note: p Values reflect the statistical significance level of paired t-tests comparing each method with the extraction assay (reference standard).
The gravimetric method was evaluated to understand the source of its inaccuracy better. Of the 757 sponges measured, QBLGrav exceeded the blood content determined by the assay method in all but 8. The QBLGrav measurements exhibited poor correlation (r 2 = 0.2682) with the assay and systematically overestimated sponge blood content (Fig. 4) most likely due to the addition of absorbed amniotic and irrigation fluid to the blood collected on the sponges. This inaccuracy persisted despite the corrections for amniotic and irrigation fluid that were made to the total blood loss measures.
Fig. 4.
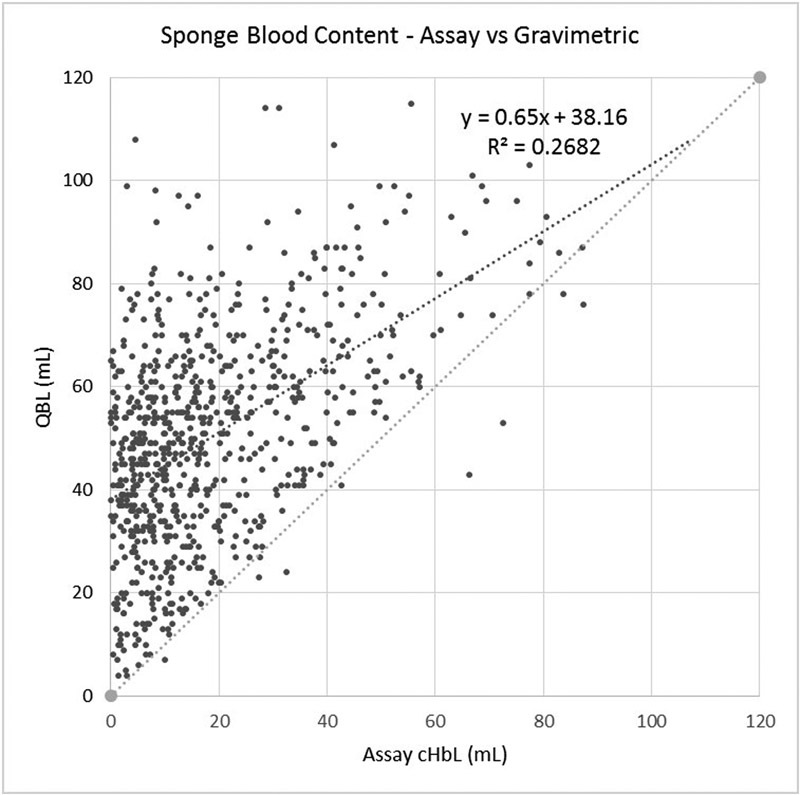
Scatter plot of the blood content of each sponge comparing the assay and gravimetric methods.
The relationship between blood losses measured by the various methods versus the extraction assay method is described in Table 2 and illustrated by scatter plots in Fig. 5. Assessment of agreement between the various measurements and the extraction assay method according to Bland–Altman method is provided in Table 3 and Figs. 6 7 8.
Table 2. Linear correlation of blood loss measurements versus extraction assay (reference standard).
| Method | Correlation coefficient (95% CI) | Standardized coefficient | p Value | Adjusted R2 |
|---|---|---|---|---|
| Visual EBL | 0.700 (0.523–0.819) | 0.700 | < 0.001 | 0.479 |
| QBLGrav (adjusted) | 0.564 (0.339–0.728) | 0.564 | < 0.001 | 0.304 |
| Colorimetric | 0.951 (0.915–0.972) | 0.951 | < 0.001 | 0.902 |
Abbreviations: CI, confidence interval; EBL, estimated blood loss; QBLGrav, quantitative blood loss.
Fig. 5.
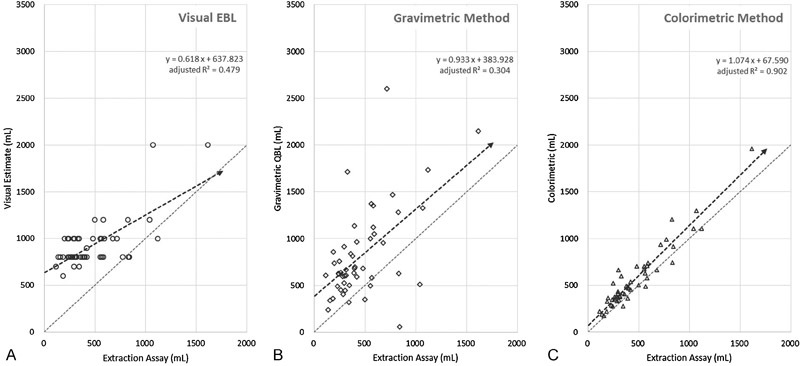
Scatter plots of blood loss measured by (A) visual estimation, (B) gravimetric method, and (C) colorimetric method compared with the assay method. A line of unity representing perfect correlation is shown for comparison.
Table 3. Assessment of agreement between methods of measuring blood loss and the extraction assay (reference standard).
| Visual EBL (mL) | QBLGrav (adjusted) (mL) | Colorimetric (mL) | |
|---|---|---|---|
| Bias (95% CI) (mL) | 458 | 352 | 102 |
| SD (error) (mL) | 218 | 405 | 106 |
| Upper limit of agreement (95% CI) (mL) | 886 | 1,145 | 309 |
| Lower limit of agreement (95% CI) (mL) | 31 | −441 | −105 |
| RMSE (mL) | 507 | 533 | 146 |
| CI (bias) | 62 | 115 | 30 |
CI (LOAs)—calculated as 
|
105 | 194 | 51 |
Abbreviations: CI, confidence interval; EBL, estimated blood loss; LOA, limits of agreement; QBLGrav, quantitative blood loss; RMSE, root mean square error; SD, standard deviation.
Fig. 6.
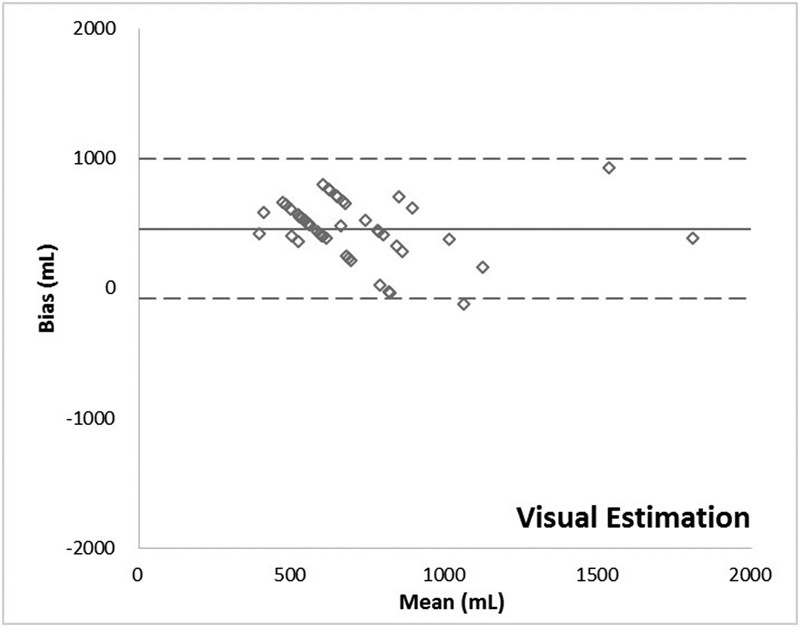
Bland–Altman plot: Visual method.
Fig. 7.
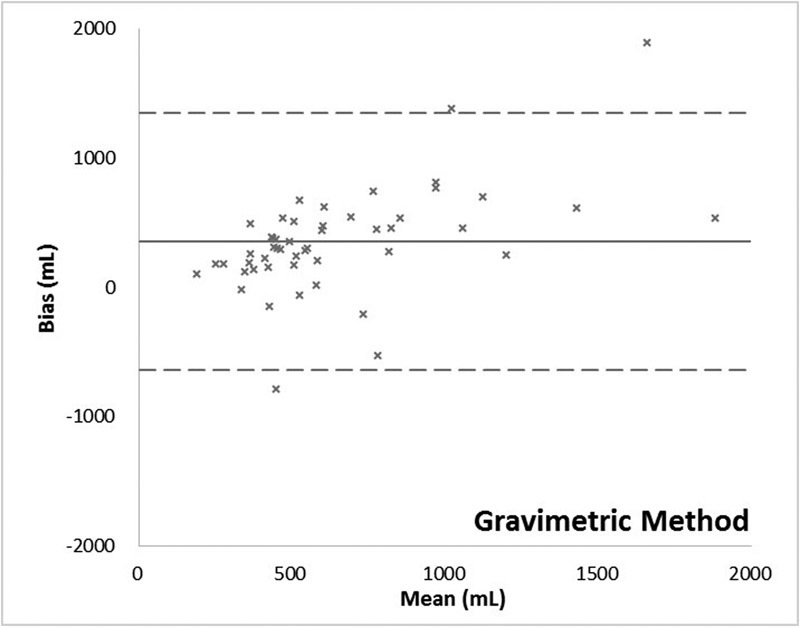
Bland–Altman plot: Gravimetric method.
Fig. 8.
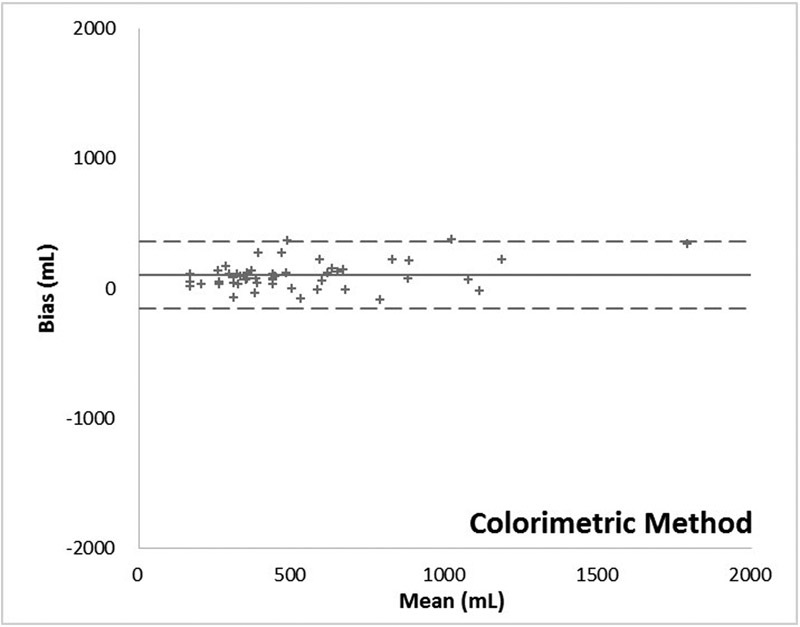
Bland–Altman plot: Colorimetric method.
Comment
This study demonstrates that when using an extraction assay method as a reference standard, cumulative blood loss is more accurately assessed by the colorimetric method than by either visual estimation or the widely recommended quantitative gravimetric method. Visual estimation demonstrated a slightly better correlation to the assay than gravimetric estimation because, despite adjustments, the quantitative gravimetric method tended to overestimate blood loss consistently. This was presumably due to the effects of amniotic fluid and irrigants that inevitably mix with the blood collected on surgical sponges and within suction canisters confounding the results of weighing the sponges and measuring the volume in the canisters.
The regression curve for visual estimation demonstrates a slope well below 1.0 suggesting that the providers' estimates of the amount of blood loss were virtually unrelated to the reference values (Fig. 5A). In fact, if a few of the high estimates were removed the slope would have approached zero. Clinicians never estimated a blood loss of less than 500 mL, and yet the reference data demonstrates that 66% of patients had such values. These data confirm that surgeons and other medical personnel are inaccurate in visually estimating blood loss.9
Historical data supporting the quantitative gravimetric method of measuring blood loss is mixed. For example, Lilley et al,12 concluded that in a mixed group of vaginal and cesarean deliveries gravimetric assessment of blood loss during postpartum hemorrhage (PPH) was effective, while Johar et al,11 determined that in surgical procedures the technique was frequently inaccurate due to issues such as recording bias, amniotic fluid/saline corruption, and human error. Data from this study illustrate the persistent challenges posed by this methodology in cesarean deliveries where blood and nonsanguineous fluids frequently mix. Specifically, the quantitative gravimetric technique showed a lower correlation with actual blood loss than the colorimetric method as evidenced by the lower R-value. This variation includes several cases where there was a significant deviation, both above and below the actual blood loss. In 34% of the cases the quantitative gravimetric method overestimated the blood loss by greater than 500 mL when compared with the reference standard (mean = 761 ± 370 mL for those cases) and in two cases the quantitative gravimetric method underestimated the blood loss by more than 500 mL. However, unlike visual estimation, gravimetric methods did effectively quantify blood losses of less than 500 mL in many patients. The cases where the gravimetric estimate of blood loss was greater than the blood loss calculated from the Hgb loss determined by the extraction assay method can be plausibly explained by visual underestimation of the amount of irrigation and amniotic fluid in the canister, lower preoperative Hgb concentration (since the weight of additional plasma is included) or significant amounts of irrigation and/or amniotic fluid on the sponges. Underestimation by the quantitative gravimetric method likely resulted from the reverse of these conditions.
Accurate blood loss estimation is clinically valuable and may substantially alter the timing of interventions to control hemorrhage. Overestimation during cesarean delivery may lead patients, particularly those who have minimal postpartum blood loss following the procedure, to have unnecessary laboratory evaluation and exposure to unneeded medications and/or transfusions. Conversely, underestimation may lead to a delay in evaluation and treatment, particularly if further blood loss occurs postpartum. This risk may be exacerbated by the fact that patients with presumed low blood loss may be placed in care environments with the lower nurse to patient ratios and less intensive monitoring. Furthermore, patients with underestimated blood loss may not receive appropriate blood, or blood component therapy is potentially leading to excessive hemorrhage from dilutional anemia and/or coagulopathy.
A limitation of this study is that it investigated a patient population having surgical blood losses mostly within the normal range. The population studied did not have a substantial number of patients with excessive blood loss, and therefore comparisons between the various methods could not be made for that situation. Nonetheless, the colorimetric method is likely to be accurate in patients experiencing massive hemorrhage since the study validates the comparative accuracy of colorimetry in measuring blood loss on individual sponges and in each canister. In cases with increased hemorrhage, one would expect that there would simply be more sponges and larger volumes in the canisters. In contrast, both visual estimation and the quantitative gravimetric method would be prone to greater variation with increased blood loss. A strength of this study is that a rigorous and detailed evaluation of all three methods was conducted and compared the results to a validated reference standard. Although all sponge/canister image capture and analysis in this study was done at the conclusion of surgery, the use of this tool has previously been effectively implemented “real-time” during surgical procedures, thus providing continuous and ongoing monitoring of blood loss.15
The blood losses measured in this study were typically less than that commonly estimated for cesarean delivery. This may be due to the failure of the extraction assay, colorimetric and gravimetric methods to account for blood loss on surgical drapes. Alternatively, the data could be interpreted as demonstrating that those traditional estimates are often incorrect. Further studies are needed to determine whether data using the colorimetric method is sufficiently accurate to predict postoperative Hgb levels and guide therapy.
This study demonstrates that both visual and quantitative gravimetric methods of measuring blood loss during cesarean deliveries are unreliable and colorimetric image analysis using a computer-based algorithmic system provides more accurate results. Accurate, real-time measurement of blood loss has the potential to facilitate proper implementation of obstetric hemorrhage protocols to improve patient care. Further study of these methods and workflows, particularly in patients with larger amounts of perioperative bleeding, is warranted.
Acknowledgments
Financial Support: Gauss Surgical, Inc. provided statistical support services and the colorimetric device used in the study. Gauss personnel also participated in study design, data collection, and analysis, and article preparation.
The authors would like to recognize and thank Keng-Tsai Lin, BS, Xuan Dang, BS, and John-Allen Smith, BA, Research Associates, Gauss Surgical, Inc. and Mazyar Javidroozi, MD, PhD, Director, Clinical Research, Department of Anesthesiology, Englewood Medical Center, Englewood, NJ for their contributions to this study.
Footnotes
Conflict of Interest Mr. Hsieh and Dr. Thurer are employees of Gauss Surgical, Inc. The remaining authors have no conflicts to report.
References
- 1.Callaghan W M, Kuklina E V, Berg C J. Trends in postpartum hemorrhage: United States, 1994-2006. Am J Obstet Gynecol. 2010;202(04):3530–3.53E8. doi: 10.1016/j.ajog.2010.01.011. [DOI] [PubMed] [Google Scholar]
- 2.Berg C J, Harper M A, Atkinson S M et al. Preventability of pregnancy-related deaths: results of a state-wide review. Obstet Gynecol. 2005;106(06):1228–1234. doi: 10.1097/01.AOG.0000187894.71913.e8. [DOI] [PubMed] [Google Scholar]
- 3.Lyndon A, Lagrew D, Shields L, Main E, Cape V. Improving Health Care Response to Obstetric Hemorrhage. (California Maternal Quality Care Collaborative Toolkit to Transform Maternity Care) Developed under contract #11–10006 with the California Department of Public Health; Maternal, Child and Adolescent Health Division; Published by the California Maternal Quality Care Collaborative, 3/17/15. Available at: http://health.utah.gov/uwnqc/documents/CaliforniaToolkittoTransformMaternityCare.pdf. Accessed August 1, 2016
- 4.Main E K, Goffman D, Scavone B M et al. National Partnership for Maternal Safety: consensus bundle on obstetric hemorrhage. Anesth Analg. 2015;121(01):142–148. doi: 10.1097/AOG.0000000000000869. [DOI] [PubMed] [Google Scholar]
- 5.Brasel K J, Guse C, Gentilello L M, Nirula R. Heart rate: is it truly a vital sign? J Trauma. 2007;62(04):812–817. doi: 10.1097/TA.0b013e31803245a1. [DOI] [PubMed] [Google Scholar]
- 6.Convertino V A, Moulton S L, Grudic G Zet al. Use of advanced machine-learning techniques for noninvasive monitoring of hemorrhage J Trauma 201171(1, Suppl):S25–S32. [DOI] [PubMed] [Google Scholar]
- 7.Orlinsky M, Shoemaker W, Reis E D, Kerstein M D.Current controversies in shock and resuscitation Surg Clin North Am 200181061217–1262., xi–xii [DOI] [PubMed] [Google Scholar]
- 8.Bose P, Regan F, Paterson-Brown S. Improving the accuracy of estimated blood loss at obstetric haemorrhage using clinical reconstructions. BJOG. 2006;113(08):919–924. doi: 10.1111/j.1471-0528.2006.01018.x. [DOI] [PubMed] [Google Scholar]
- 9.Schorn M N. Measurement of blood loss: review of the literature. J Midwifery Womens Health. 2010;55(01):20–27. doi: 10.1016/j.jmwh.2009.02.014. [DOI] [PubMed] [Google Scholar]
- 10.Toledo P, Eosakul S T, Goetz K, Wong C A, Grobman W A. Decay in blood loss estimation skills after web-based didactic training. Simul Healthc. 2012;7(01):18–21. doi: 10.1097/SIH.0b013e318230604f. [DOI] [PubMed] [Google Scholar]
- 11.Johar R S, Smith R P. Assessing gravimetric estimation of intraoperative blood loss. J Gynecol Surg. 1993;9(03):151–154. doi: 10.1089/gyn.1993.9.151. [DOI] [PubMed] [Google Scholar]
- 12.Lilley G, Burkett-St-Laurent D, Precious E et al. Measurement of blood loss during postpartum haemorrhage. Int J Obstet Anesth. 2015;24(01):8–14. doi: 10.1016/j.ijoa.2014.07.009. [DOI] [PubMed] [Google Scholar]
- 13.Holmes A A, Konig G, Ting V et al. Clinical evaluation of a novel system for monitoring surgical hemoglobin loss. Anesth Analg. 2014;119(03):588–594. doi: 10.1213/ANE.0000000000000181. [DOI] [PMC free article] [PubMed] [Google Scholar]
- 14.Konig G, Holmes A A, Garcia R et al. In vitro evaluation of a novel system for monitoring surgical hemoglobin loss. Anesth Analg. 2014;119(03):595–600. doi: 10.1213/ANE.0000000000000198. [DOI] [PMC free article] [PubMed] [Google Scholar]
- 15.Sharareh B, Woolwine S, Satish S, Abraham P, Schwarzkopf R. Real time intraoperative monitoring of blood loss with a novel tablet application. Open Orthop J. 2015;9:422–426. doi: 10.2174/1874325001509010422. [DOI] [PMC free article] [PubMed] [Google Scholar]
- 16.Hill S E, Broomer B, Stover J, White W.Accuracy of estimated blood loss in spine surgery. In: Proceedings of the American Society of Anesthesiologists (ASA) 2011 Annual Meeting; October 15–19, 2011Chicago, IL. Abstract A054 [Google Scholar]
- 17.Hill S E, Broomer B, Stover J, White W, Richardson W. Bipolar tissue sealant device decreases hemoglobin loss in multilevel spine surgery. Transfusion. 2012;52(12):2594–2599. doi: 10.1111/j.1537-2995.2012.03649.x. [DOI] [PubMed] [Google Scholar]
- 18.Newton J, Barnard G, Collins W. A rapid method for measuring menstrual blood loss using automated extraction. Contraception. 1977;16:269–282. [Google Scholar]
- 19.Magnay J L, Schönicke G, Nevatte T M, O'Brien S, Junge W. Validation of a rapid alkaline hematin technique to measure menstrual blood loss on feminine towels containing superabsorbent polymers. Fertil Steril. 2011;96(02):394–398. doi: 10.1016/j.fertnstert.2011.05.096. [DOI] [PubMed] [Google Scholar]
- 20.van Eijkeren M A, Scholten P C, Christiaens G C, Alsbach G P, Haspels A A.The alkaline hematin method for measuring menstrual blood loss--a modification and its clinical use in menorrhagia Eur J Obstet Gynecol Reprod Biol 198622(5-6):345–351. [DOI] [PubMed] [Google Scholar]
- 21.Bland J M, Altman D G.Statistical methods for assessing agreement between two methods of clinical measurement Lancet 19861(8476):307–310. [PubMed] [Google Scholar]
- 22.Guinn N R, Broomer B W, White W, Richardson W, Hill S E. Comparison of visually estimated blood loss with direct hemoglobin measurement in multilevel spine surgery. Transfusion. 2013;53(11):2790–2794. doi: 10.1111/trf.12119. [DOI] [PubMed] [Google Scholar]
- 23.Bland J M, Altman D G. How can I decide the sample size for a study of agreement between two methods of measurement? Updated: January 12, 2004. Available at: http://www-users.york.ac.uk/∼mb55/meas/sizemeth.htm. Accessed September 23, 2016


