
Fig. 5.
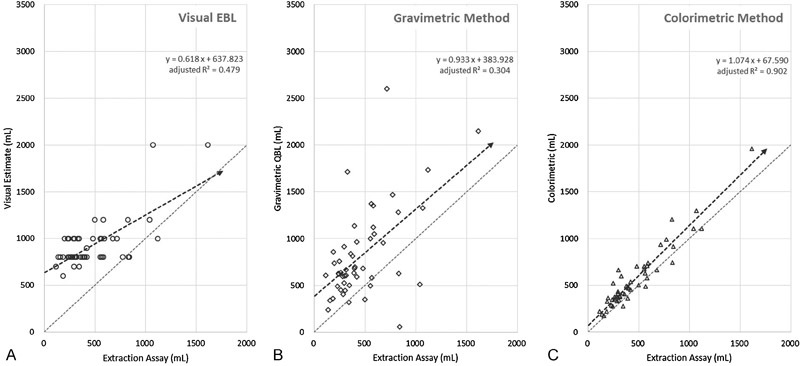
Scatter plots of blood loss measured by (A) visual estimation, (B) gravimetric method, and (C) colorimetric method compared with the assay method. A line of unity representing perfect correlation is shown for comparison.
Official websites use .gov
A
.gov website belongs to an official
government organization in the United States.
Secure .gov websites use HTTPS
A lock (
) or https:// means you've safely
connected to the .gov website. Share sensitive
information only on official, secure websites.
Scatter plots of blood loss measured by (A) visual estimation, (B) gravimetric method, and (C) colorimetric method compared with the assay method. A line of unity representing perfect correlation is shown for comparison.