
Figure 2. Emergence of the OB phenotype via progressive loss of melanophores.
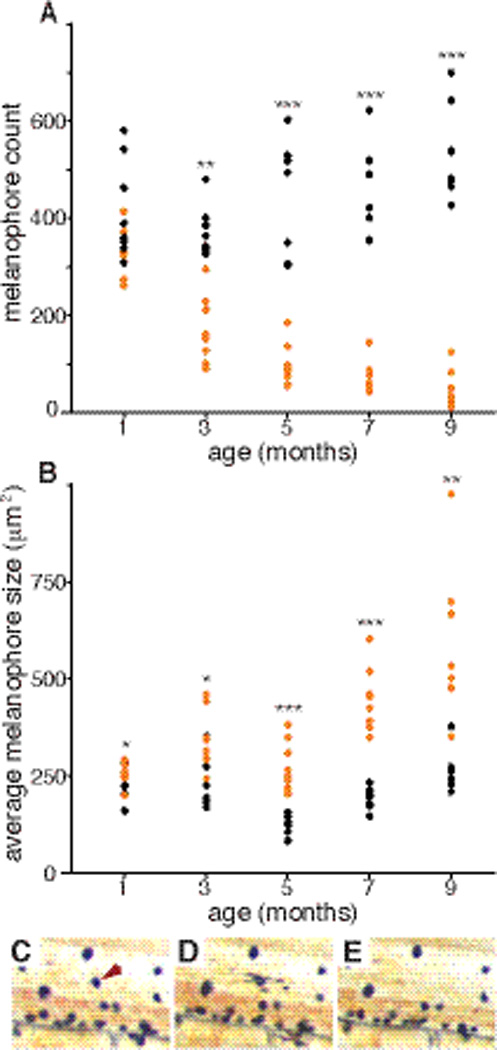
(A) Melanophore number and (B) contracted melanophore size were measured in the caudal fin of the same M. tarakiki individuals through juvenile development. Black and orange symbols indicate P and OB morph individuals, respectively (n = 8 each P and OB morph individuals; by morph t-test p values: *<0.05, **<0.01, ***<0.001). (C–E) Images of the same area of caudal fin in an M. tarakiki OB morph juvenile. On day 1 (C), a melanophore (arrowhead) is responsive to contraction by epinephrine. On day 2 (D) the melanophore responds abnormally with a partially contracted, blebbed appearance, and is cleared from the tissue by day 3 (E).