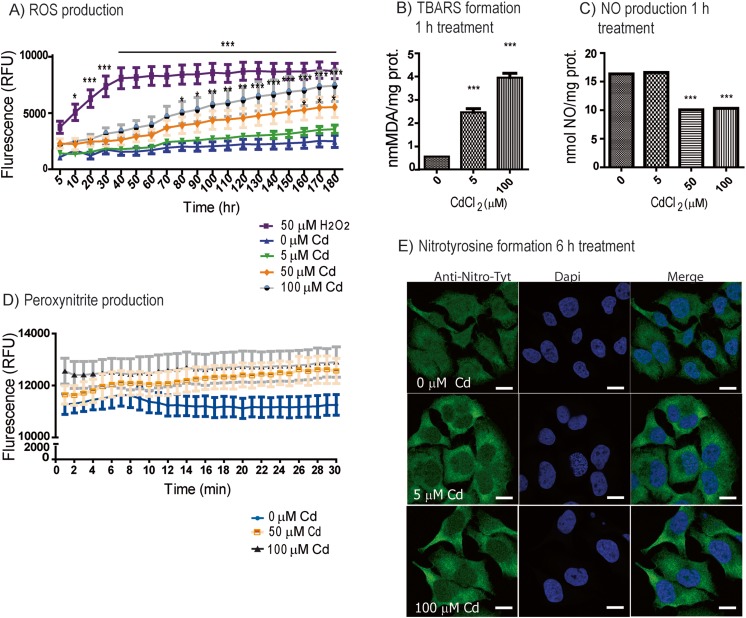
Fig. 1.
Cd treatment induces oxidative stress. a ROS assay measured in HeLa cells pre-loaded with H2DCFDA reagent for 40 min, washed, and then treated with Cd or H2O2 for the indicated time and concentrations and recorded at Ex/Em 495/525 nM. The results were expressed as relative fluorescence units (RFU). Values represent the means of three independent experiments ±SD (*p < 0.05; **p < 0.01; ***p < 0.001). b Lipid peroxidation as measured by TBARS formation after 1 h Cd treatment. c NO production in HeLa cells exposed to the indicated concentrations of Cd for 1 h (***p < 0.001). The results represent mean ± SD of three independent experiments (***p < 0.001). d Peroxynitrite production assayed in HeLa cells pre-loaded with probe 1 exposed to Cd. The spectra were obtained each minute during a period of 30 min, and fluorescence intensity at 540 nm was measured with excitation at 430 nm. Positive control was performed with SIN-1 and negative control with H2O2 (10 μM) as shown in Supp. Fig. 1a. Values represent the means of three independent experiments ± SD. e Confocal images of nitrotyrosine labeling in HeLa cells after treatment with 0, 5, and 100 μM Cd after 6 h. Green: nitrotyrosine; blue: DAPI; bar: 8 nm (color figure online)

