
Figure 2.
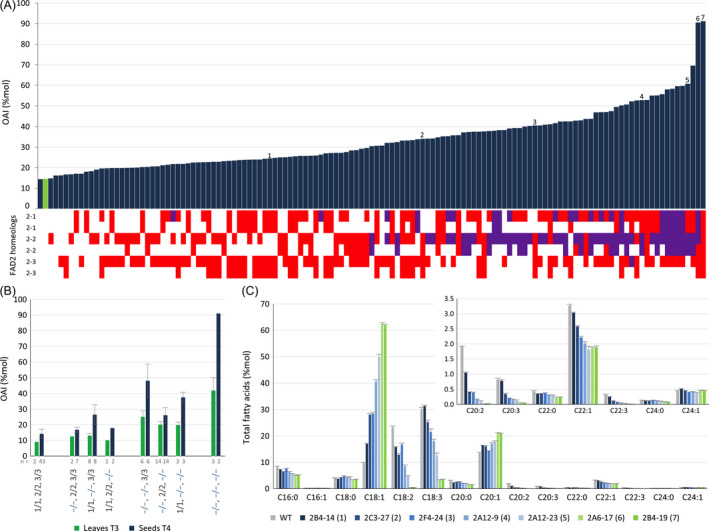
Combinatorial csfad2 alleles changes seed lipid profile. (A) Distribution of csfad2 allele combinations at the CsFAD2‐1, CsFAD2‐2 and CsFAD2‐3 loci in individual T3 lines (bottom) and the resulting effect on OAI of T4 seed progeny (top). Numbers indicate the lines selected for oil analysis (line names are indicated in C). Mutations leading to sequence frameshift are indicated in red, while those only associated with deletion or insertion without frameshift are indicated in purple. (B) OAI in simple, double and triple homozygous csfad2 mutants. Uppercase, WT allele. Blue lowercase, mutated allele. The number of lines used for each genetic combination is indicated (n). (C) Relative fatty acid profile of T4 seeds from 7 csfad2 CRISPR lines selected in (A).