
Figure 5.
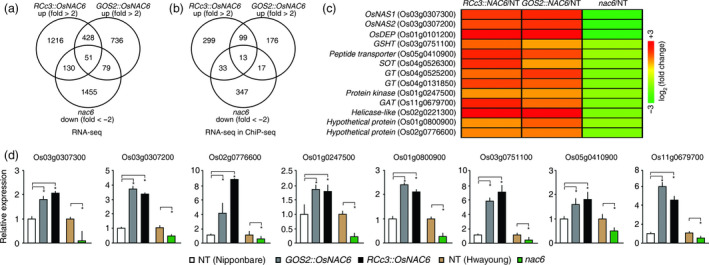
Transcriptomic analysis of RCc3::OsNAC6, GOS2::OsNAC6 and nac6 roots and a comparison between RNA‐seq and ChIP‐seq data. (a) Venn diagram of up‐regulated genes in roots of 2‐week‐old RCc3::OsNAC6 and GOS2::OsNAC6 relative to NT plants (cut‐off, ≥ 2.0‐fold) and down‐regulated genes in roots of nac6 relative to NT plants (cut‐off, ≤−2.0‐fold), using RNA‐seq. (b) Venn diagram showing the number of potential genes directly up‐regulated by OsNAC6 by comparing RNA‐seq with ChIP‐seq data. (c) Thirteen high‐confidence target genes up‐regulated by OsNAC6 and a heatmap of their expression levels based on RNA‐seq data. (d) qRT‐PCR verification of genes up‐regulated by OsNAC6. UBIQUITIN 1 expression was used as an internal control. Values shown as the mean + SD of two biological replicates, each of which had two technical replicates. Asterisks indicate significant differences compared to NT control plants (P < 0.05, Student's t‐test).