Figure 6.

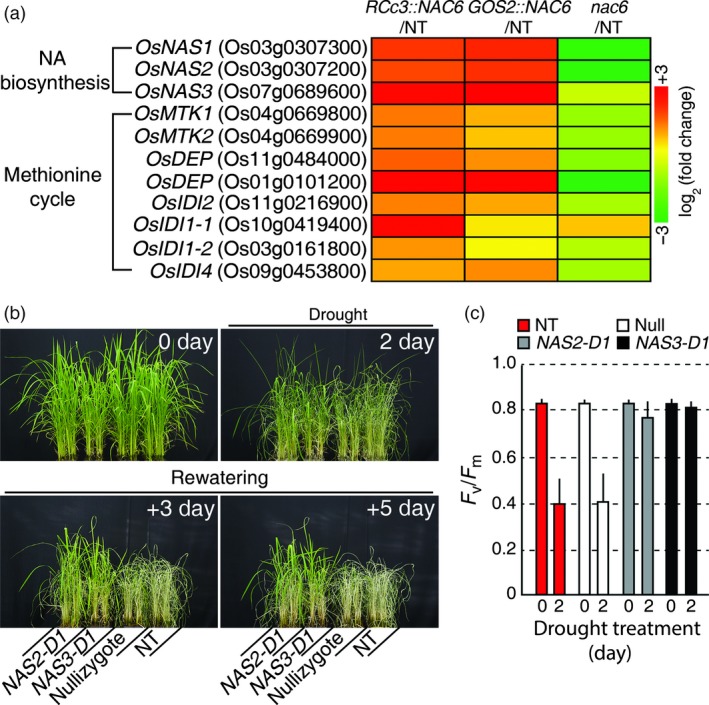
Drought tolerance of OsNAS2‐D1 and OsNAS3‐D1. (a) Expression levels of genes related to NA biosynthesis and the methionine cycle regulated by OsNAC6, based on RNA‐seq data. (b) Drought tolerance of OsNAS2‐D1 and OsNAS3‐D1 plants at a vegetative developmental stage. Four‐week‐old plants were exposed to drought for 5 days, followed by re‐watering. The numbers of days on the images indicate the duration of the drought (2 day means plants that were exposed to drought stress for 2 days) and re‐watering (+3 and +5 day mean plants that were re‐watered for three and 5 days, respectively). (c) Photochemical efficiency (F v/F m) of OsNAS2‐D1 and OsNAS3‐D1 rice plants, grown in a greenhouse at 28–30 °C for 4 weeks and drought treated for 2 days. Each value represents the mean + SE (n = 30 for each genotype).
