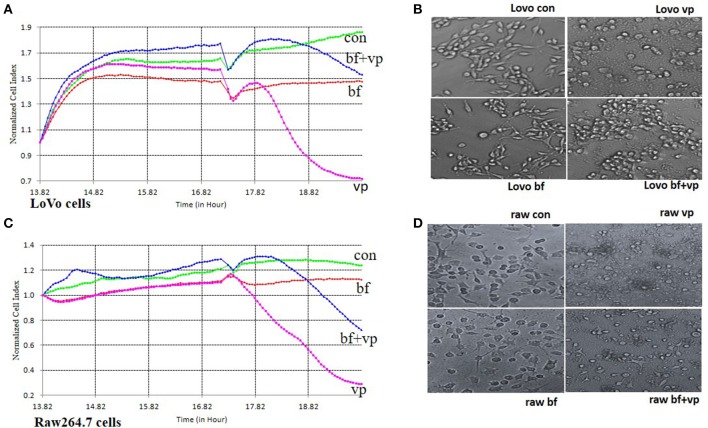
Figure 2.
RTCA pathogen inhibition assay. (A) The RTCA Normalized Cell Index (NCI) curves of the LoVo cells co-incubated with medium (con), B. fragilis (bf), V. parahaemolyticus (vp), or both two bacteria (bf+vp). (B) The light morphology of the LoVo cells co-incubated with medium, B. fragilis, V. parahaemolyticus, or both two bacteria (200 ×). (C) The RTCA NCI curves of the Raw 264.7 cells co-incubated with medium, B. fragilis, V. parahaemolyticus, or both two bacteria. (D) The light morphology of the Raw 264.7 cells co-incubated with medium, B. fragilis, V. parahaemolyticus, or both two bacteria (200 ×). All the cells were cultured overnight and the cells of the bf+vp groups and bf groups were added with B. fragilis (MOI = 500) at about 14 h, V. parahaemolyticus (MOI = 50) was added to the cells of the bf+vp groups and vp groups at 17 h, the observation was finished after another 3 h. The NCI curves could represent the growth state of the cells during the whole time. The normal LoVo cells are spindle-shaped and the normal Raw264.7 cells are polygon as shown in (B,D) con group, when the cells were damaged, they became sparse, rounding and shedding as shown in (B,D) vp group, the bf group shaped like the con group and the bf+vp group shaped between the con group and the vp group.

