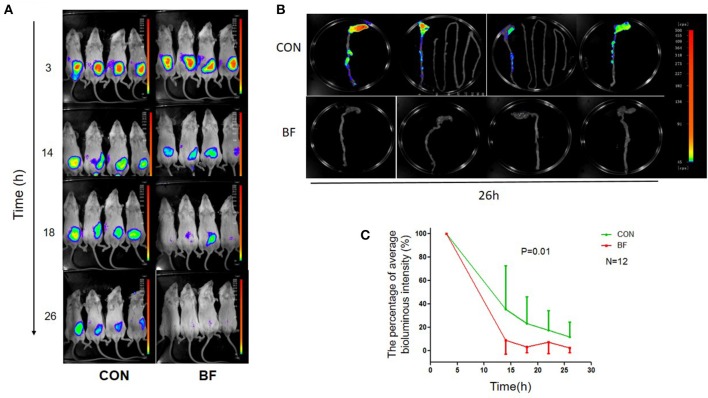
Figure 4.
Bioluminescence imaging of the mice. (A) Bioluminescence imaging of BABL/c mice in the control group (CON) and the B. fragilis treatment group (BF) infected with the lux-expressing V. parahaemolyticus. (B) Bioluminescence imaging of BABL/c mice's intestinal tracts in the control group (CON) and the B. fragilis treatment group (BF). (C) The average luminous intensity percentage at various time points of the two groups (Mean ± SD, RMANOVA).

