
FIGURE 3.
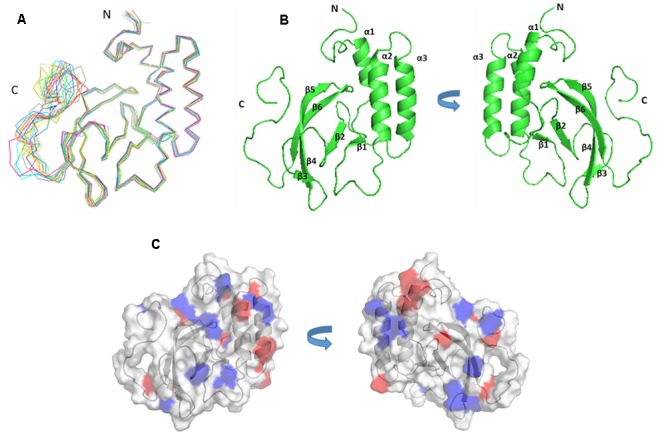
The structure and surface features of PRRSV NSP7α determined by NMR Spectroscopy. (A) Backbone trace of the ensemble of 20 superimposed lowest-energy structures of NSP7α in aqueous solution. (B) The cartoon representation of NSP7α structure in solution. (C) The surface representation of the solution structure of NSP7α. Negatively charged patches are colored in red, and positively charged regions are in blue.