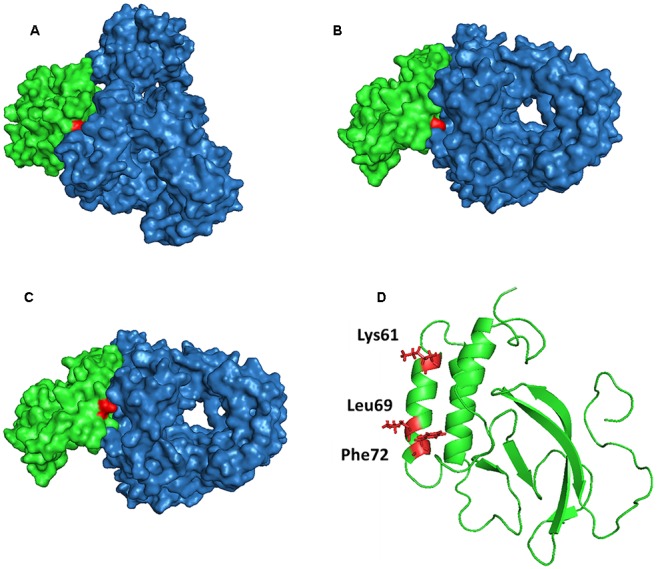
FIGURE 7.

Prediction model of NSP7α–NSP9 interaction (with evaluated energy of -27.86 kcal/mol). The surface features of the NSP7α–NSP9 interaction model are shown in (A–C). NSP7α is colored in green, NSP9 is in blue, and Lys61 (A), Leu69 (B), and Phe72 (C) are highlighted in red. (D) The three amino acid residues are highlighted in red in the cartoon representation of NSP7α structure.
