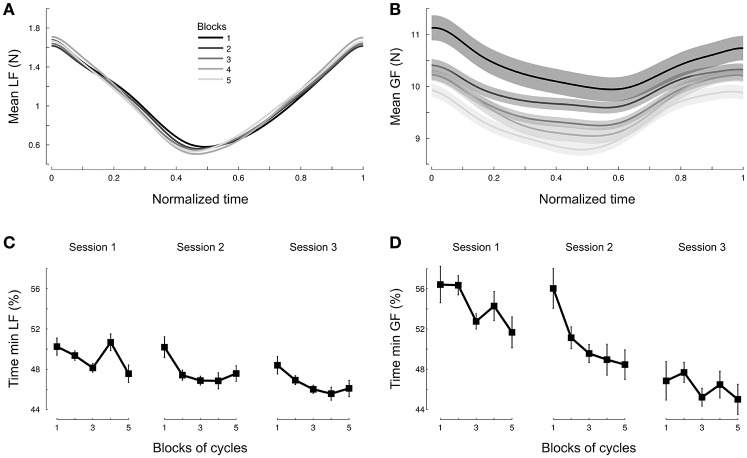
Figure 5.
Participants adjust grip force but not load force across cycles. Averaged load force profile during one cycle (A) and averaged grip force profile during one cycle (B) normalized across all conditions and depicted separately for each block of continuous cycles. Blocks 1 to 4 pool 3 cycles together and block 5 includes the last five cycles. The earlier blocks in the trial are depicted in dark gray and late blocks are shown in light gray [see legend in (A)]. The occurrence of minimum load force (C) and grip force (D) within a cycle is plotted as a function of block. The three sessions are shown separately. Time is normalized by cycle length in all panels.

