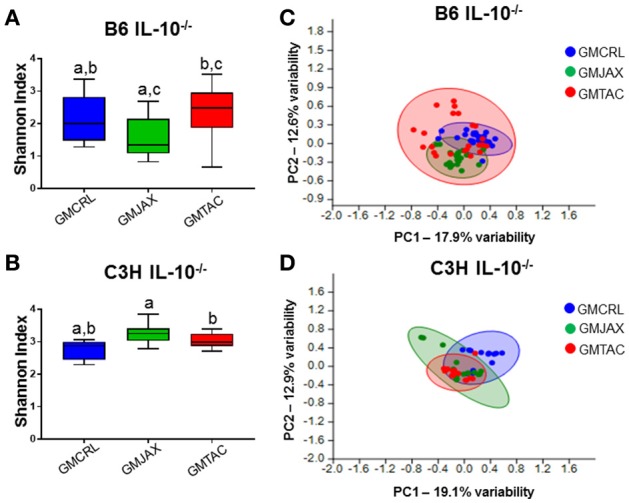
Figure 2.

Alterations in gut microbiota (GM) diversity and colonization of rederived B6 IL-10−/− and C3H IL-10−/− mice following disease onset. Shannon estimate of microbial diversity plotted by Tukey box and whisker graph of B6 (A) and C3H (B) IL-10−/− rederived mice (n = 15–25 mice per group). Statistical significance determined by one-way ANOVA with Student Newman-Keuls post-hoc test. p ≤ 0.05 is significant. Statistical significance between groups annotated by same lower case letters above box plots. Unweighted principal component analysis (PCA) of B6 (C) and C3H (D) IL-10−/− rederived mice (n = 15–25 mice per group). Blue circles, GMCRL; green circles, GMJAX; and red circles, GMTAC. Statistical significance determined by one-way PERMANOVA (shown in Table 1).
