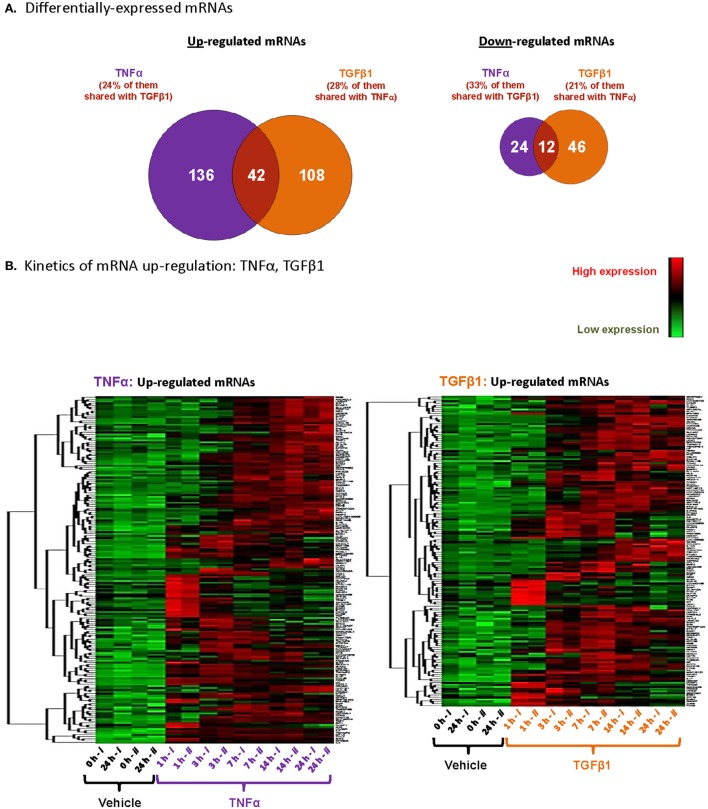
Figure 2.
TNFα and TGFβ1 induce private and shared modifications of mRNA expression in MSCs, in a time-dependent manner. Based on the array analyses described in Figure 1 with MSCs of Donor #1, total numbers of upregulated and downregulated mRNAs were determined. (A) Venn diagram, demonstrating the patterns of gene regulation in MSCs stimulated by TNFα or TGFβ1. The figure includes mRNAs modified by log2 fold change ≥ 1.5 (= fold change ≥ 2.8) with p ≤ 0.005 after Benjamini–Hochberg correction for multiple testing, compared to vehicle-treated cells. A specific gene was considered as up- or downregulated if it has passed these cutoffs at one of the time points included in the analyses. (B) Visualization of upregulated mRNAs after unsupervised clustering, using the same criteria as in panel (A). Each column represents a single replicate of each specific treatment (i, ii), and each row demonstrates a single upregulated mRNA.

