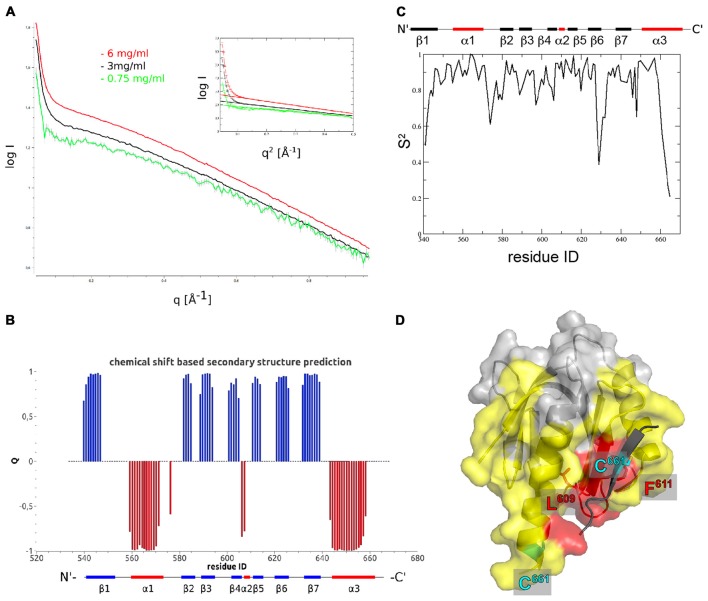
Figure 2.
The Fe65-PTB2 dimer in solution. (A) Small angle scattering data measured at three different protein concentrations. The presence of self-aggregation leads to a pronounced increase in scattering intensity at low angles. The radius of gyration extracted from the Guinier plot (inset) is slightly higher than expected for a dimer and the initial intensity values almost reaches the expected value for the dimer. (B) Secondary structure predicted from backbone chemical shifts with positive blue bars indicating β-sheets and negative red bars α-helices. The secondary structure of the accommodating subunit (long α3 helix) is shown below for comparison. (C) Backbone order parameters S2 derived from 15N nuclear magnetic resonance (NMR) spin-relaxation data. The decrease of the order parameter for the C-terminal residues indicates the unfolding of the α-helix in this region resulting in a rapid reorientation of the N-H bond vectors on a ns to ps timescale. (D) Residues experiencing paramagnetic relaxation enhancements at the backbone NH when a nitroxide spin-label is attached to C661. The protein surface of the complementing subunit is shown in color if the average intensity ratio of the observed 1H-15N peak in the paramagnetic and diamagnetic NMR spectra of the corresponding residue and its two neighbors is smaller than 0.7 and thus identifies amino acids that are close to the paramagnetic center. Residues in yellow are bleached for molecules that are simultaneously 15N and nitroxide labeled, while residues in red are also bleached when exclusively 15N and nitroxide labeled proteins are mixed. The spin-label carrying C661 residues are highlighted for the monomer (on the C-terminal α-helix) and the crystallographic dimer (on the extra β-strand).

