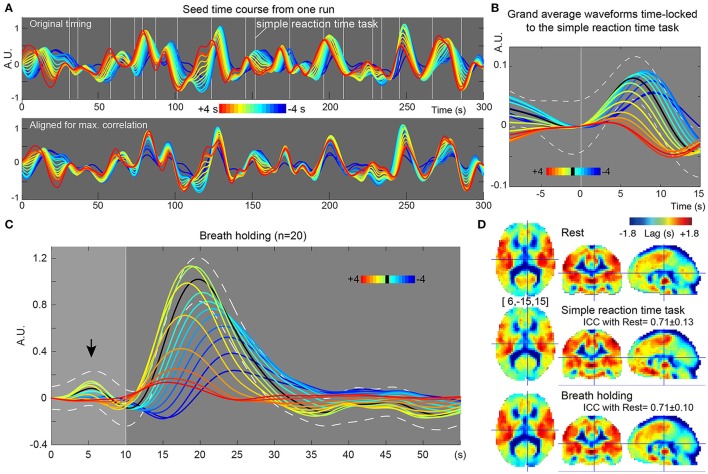
Figure 6.
Results from further evaluation of lag maps (breath-holding experiment). The color maps were chosen to represent more upstream (i.e., arterial) structure by warm colors and venous side by cool ones. The y-axes of the plots display relative MR signal intensity in arbitrary unit, which should be proportional to the normalized percent signal change. (A) Recursively generated seed-time courses on Lag-rec mapping from a single session of one subject. The phase is first tracked back from the global signal (green sweep) to 4 s earlier (red) and then tracked forward to −4 s (blue), thus expressed in the opposite polarity to the convention used in some previous works. Note that blood flow-related information is emphasized in these time courses by pooling signals from voxels sharing lag phase. White vertical lines indicate the stimulus presentation of the infrequent SRT task. (B) The time courses were subjected to time-locked averaging at the SRT task event and then grand averaged over participants. Only events separated from the previous trial by 9 s and from the following trial by 15 s were used. The black line indicates the first seed signal of lag = 0, which is almost identical to the global signal change time series (white broken lines denote a 95% confidence interval of the mean across subjects). The flow-related signal components were dispersed by this time-locked averaging in the upstream voxels, indicating that the neuro-vascular coupling is modifying the lag structure mainly in the venous side. (C) Seed time courses time-locked to the brief breath holding, pooled over the 20 participants. (D) Average Lag-rec maps for the three conditions are presented. ICCbetween indicated good reliability of the Lag-rec map in spite of the perturbation by tasks. ICCbetween between SRT and breath-holding was 0.75 ± 0.08.

