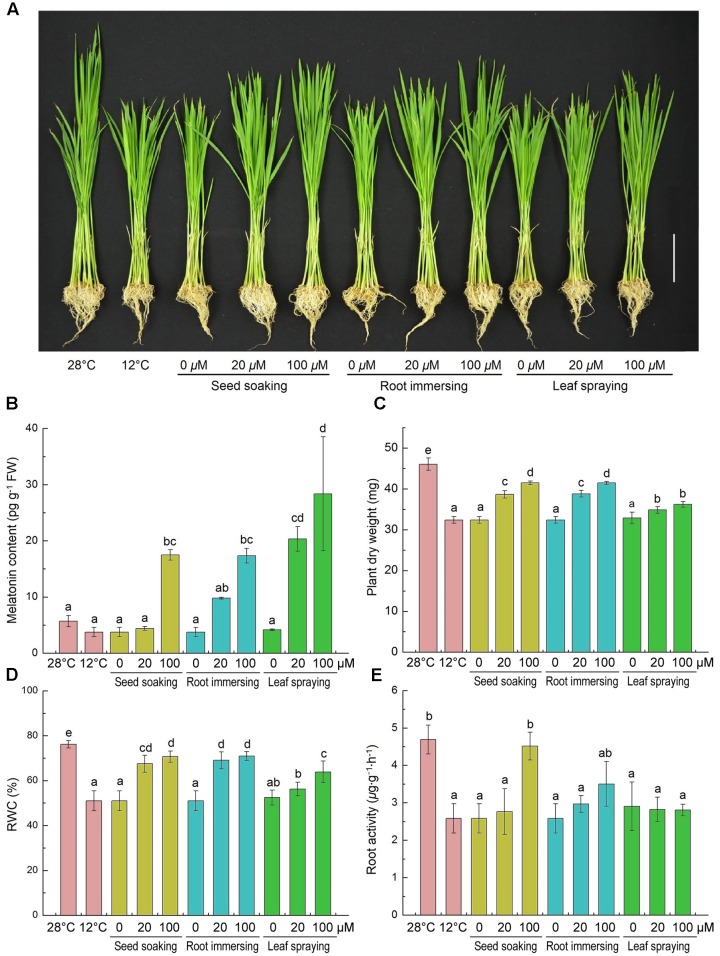
FIGURE 1.
Effects of exogenous melatonin on growth (A), melatonin content (B), plant dry weight (C), leaf relative water content (D) and root activity (E) after 6-day cold stress (12°C). (A) Bar = 5 cm. (B–E) Data represent means ± SDs of three replicate samples. Bars with different letters indicate significant differences according to Duncan’s multiple range test at P < 0.05. I – seed soaking, II – root immersion, III – leaf spraying.

