Fig. 12.
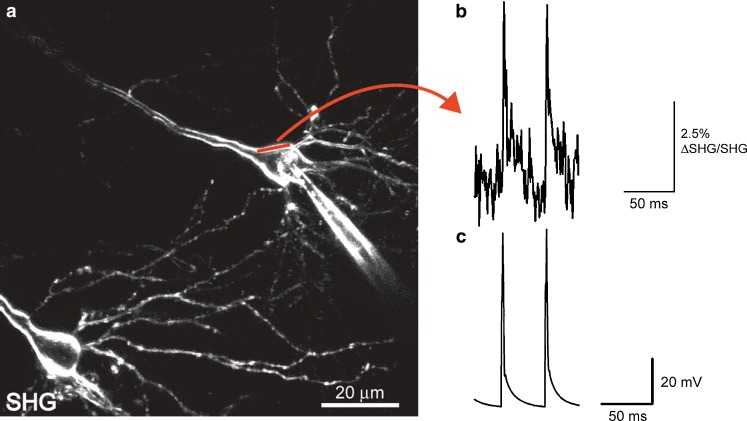
Fast SHG line scan recording of elicited action potentials in brain slice. a This neuron was patch clamped and filled with FM4-64. Straight red line represents scanned line where elicited APs were recorded optically by integrating over the width. b SHG recording intensity versus time from 55 averaged scans (1,200 lines/s) of the line shown in (a). c Average current-clamp trace of elicited APs recorded optically in (b). From Dombeck et al., J. Neurophysiol. 2005, Am Physiol Soc, used with permission

