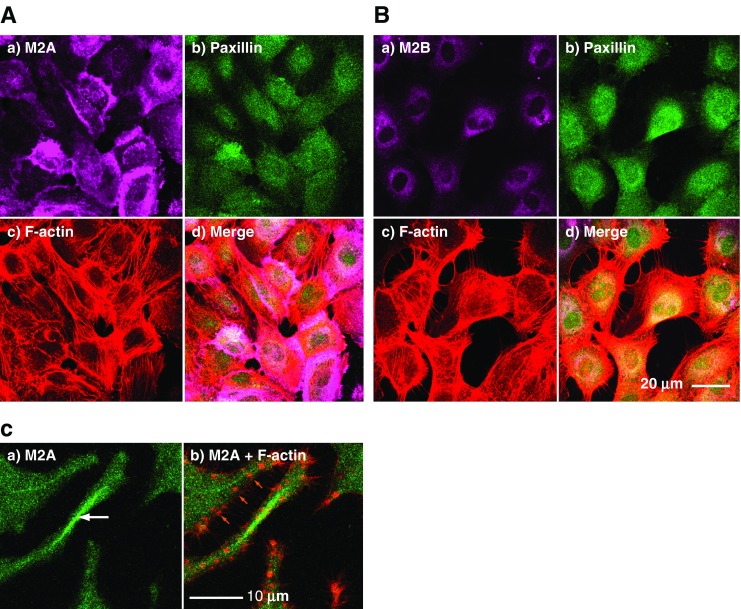
Fig. 2.

Localisation of M2A or M2B in endothelial (a,b) and neuronal (c) cell cultures. a,b Sub-confluent cultures of stationary HUVECs triple-stained to depict cytoskeletal antigens including M2A (a) and M2B (b). In each panel: a) myosin 2 (violet), b) paxillin (green), c) F-actin (red), d) merged images. Note the more peripheral distribution of M2A as compared with M2B. c High magnification image of neurites extending from cultured Neuro-2A cells indicating a ribbon-like arrangement of M2A centrally placed within a neurite, white arrow in (a), and distinct from the more particulate distribution found elsewhere in the image. In each panel: a) myosin 2A (green), b) myosin 2A (green) and F-actin (red). Note the discrete F-actin puncta which may indicate adhesion foci, orange arrows in (b)
