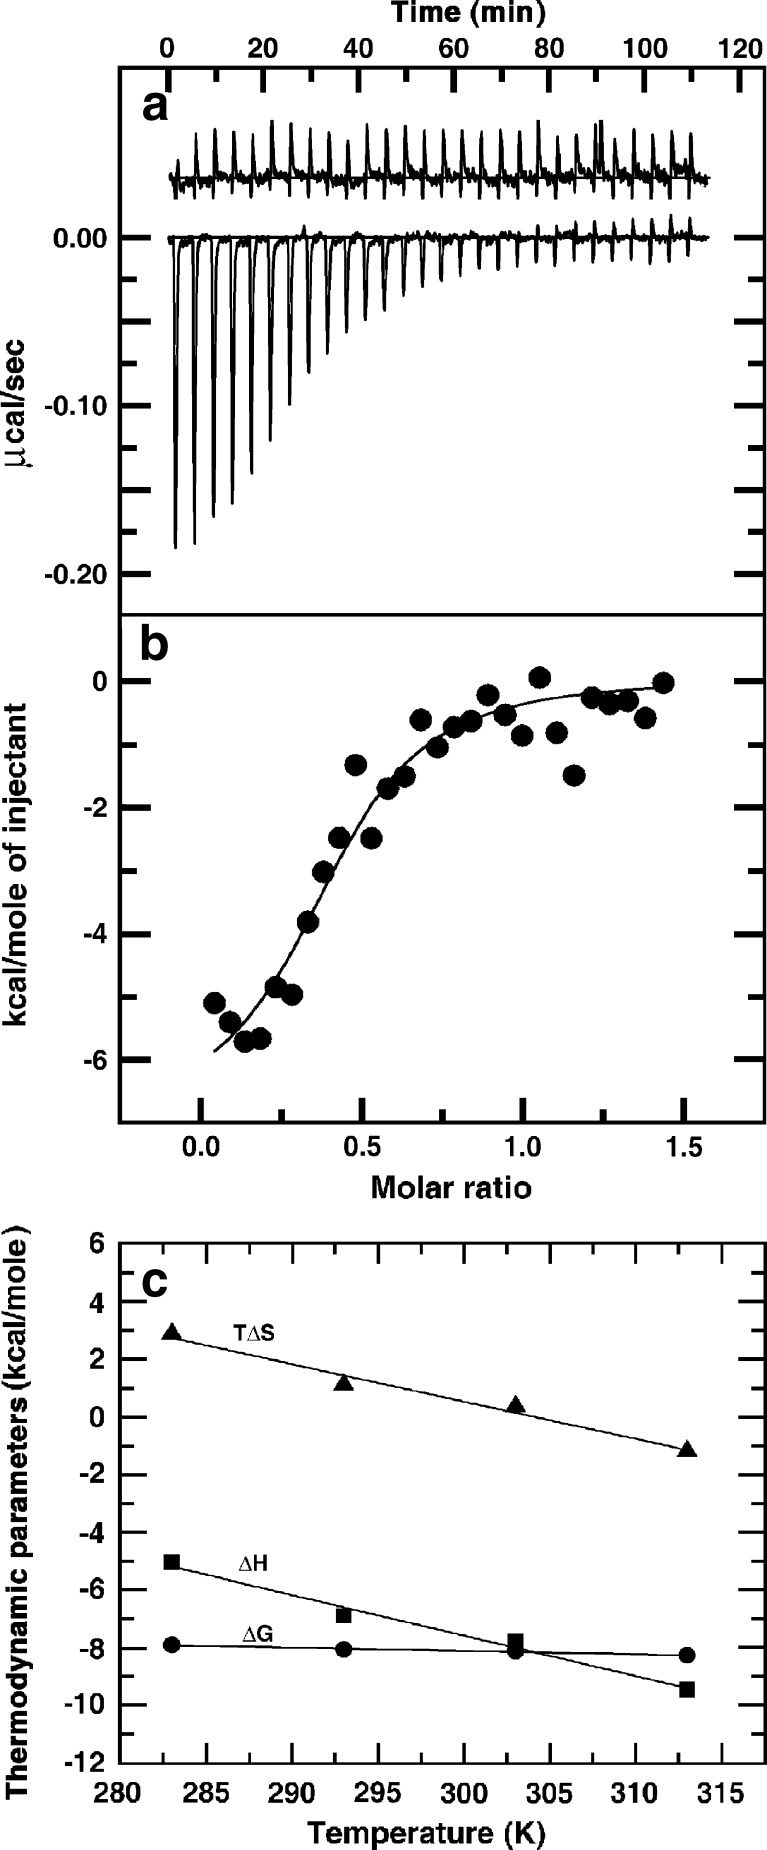
Fig. 4.
Isothermal titration calorimetry (ITC) profile for the binding of sanguinarine to calf thymus DNA. a The raw data for sequential injection of a constant amount of sanguinarine into DNA (curves on the bottom) and dilution of sanguinarine into buffer under identical conditions (curves on the top offset for clarity). b The integrated heat data after correction of heat of dilution of sanguinarine against the molar ratio of sanguinarine to DNA. c Temperature dependence of the thermodynamic parameters (∆G, ∆H, and T∆S) for the binding of sanguinarine to calf thymus DNA. [Reprinted from the PhD Thesis of M. Hossain (2009)]

