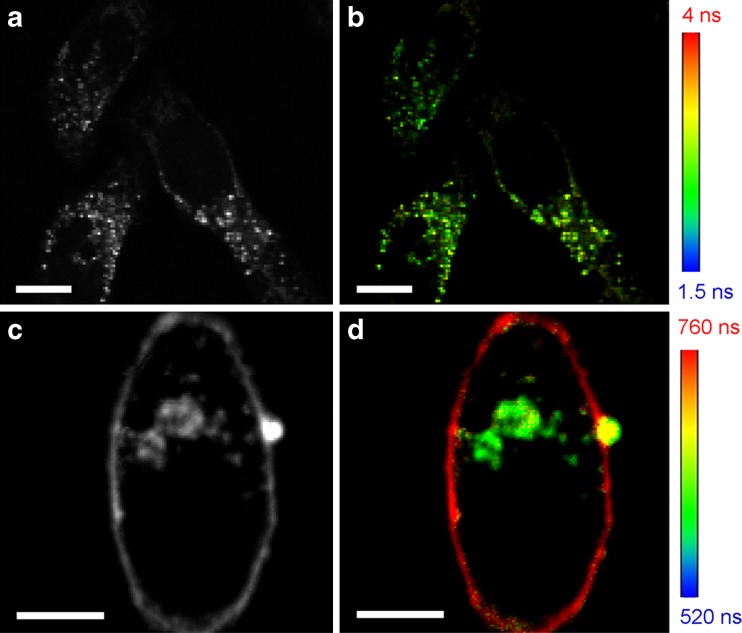
Fig. 3.
Confocal microscopy images of HeLa cells without (a, b) and with (c, d) incubation with 100 μg/ml lipoic acid-coated AuNCs for 1 h. Fluorescence intensity (a, c) and lifetime (b, d) images were taken with pulsed diode laser (470 nm) excitation and a band-pass emission filter 690/70 (center wavelength/width), using time correlated single photon counting. Lifetime maps were calculated by determining the lifetime from the fluorescence decays of all the photon counts registered for each pixel. Scale bar 10 μm

