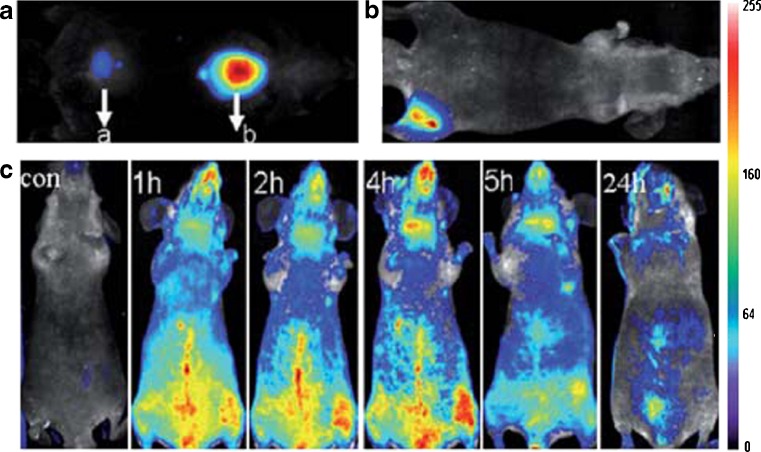
Fig. 4.
In vivo fluorescence images of mice injected with 100 μl AuNCs (a) subcutaneously (a 0.235 mg ml−1, b 2.35 mg ml−1) and (b) intramuscularly (2.35 mg ml−1). c Real-time in vivo abdomen images taken upon intravenous injection with 200 μl of AuNCs (2.35 mg ml−−1) at different time points post-injection. Reprinted with permission from the Royal Society of Chemistry (Wu et al. 2010)

