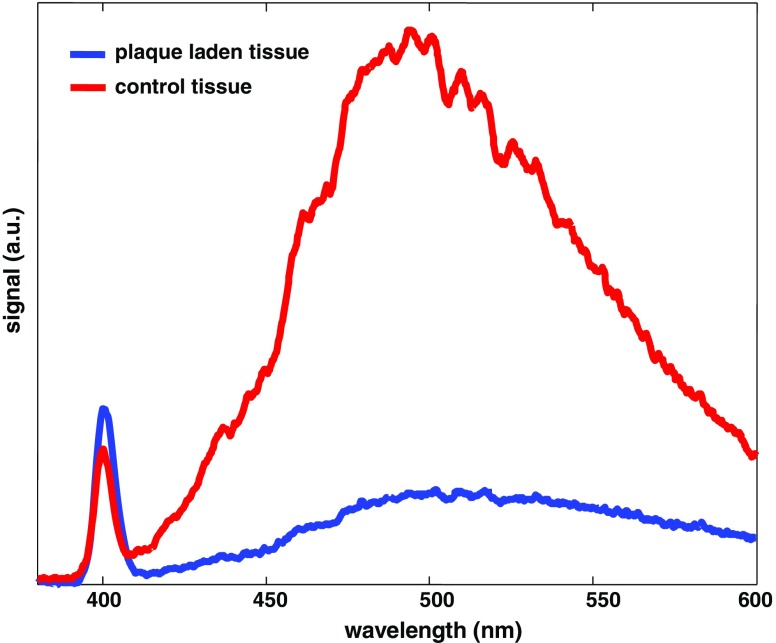
Fig. 5.
Representative two-photon emission spectra of a healthy and atherosclerotic artery lumen, respectively, at an excitation at 800 nm. The smaller/sharper band centered at 400 nm is SHG (collagen type-I) and the broader emission band centered around 500 nm is TPEF (elastin/other macromolecules, such as foam cells and macrophages). Note the dramatic different SHG/TPEF ratios between healthy and plaque-laden lumen

