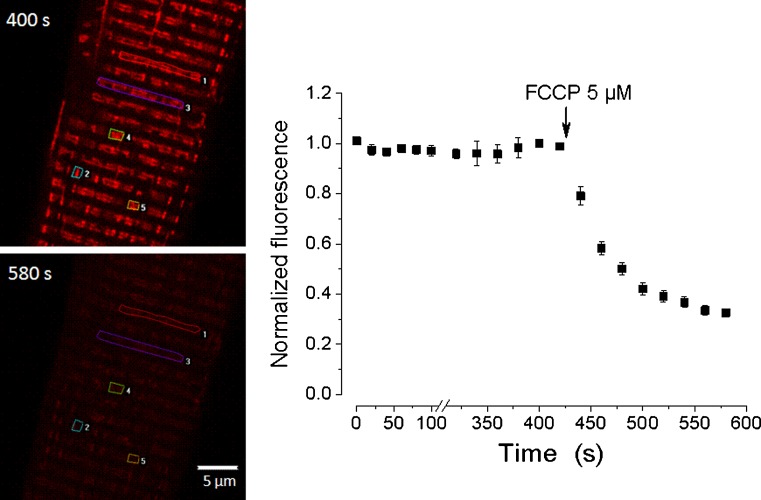
Fig. 4.
Time course of fluorescence decay after FCCP poisoning (right), in one flexor digitorum brevis fibre stained with TMRE to visualize mitochondrial potential (Ψm). On the left, confocal images of the cell indicating regions of interest (ROI, numbered squares) and time of acquisition after starting the experiment are shown. On the right, the black squares represent the mean±SEM of the measurements carried out at level of the ROI as a function of time. A rapid decrease in fluorescence, suggesting a dissipation of Ψm, is seen after the application of FCCP

