Fig. 1.
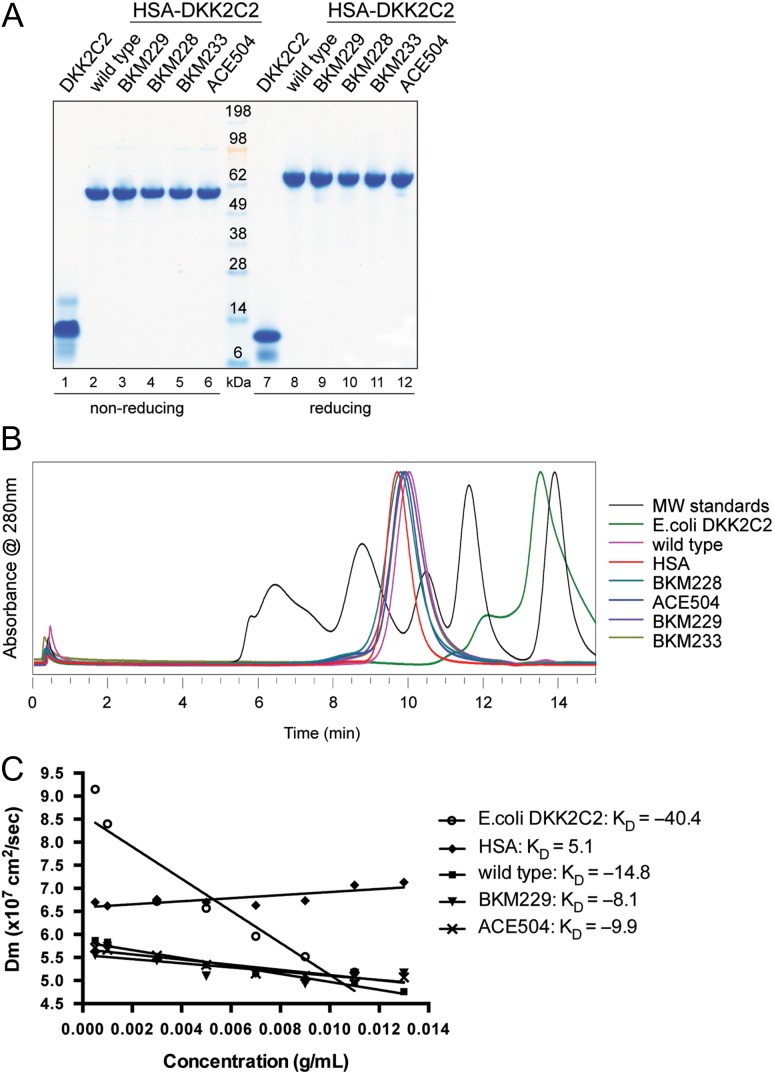
Characterization of untagged DKK2C2 and HSA-DKK2C2 fusion proteins. (A) SDS-PAGE stained with SimplyBlue SafeStain examining SEC purified DKK2C2 proteins under both non-reducing (left) and reducing conditions (right). Lanes 1 and 7: E. coli derived untagged DKK2C2; Lanes 2 and 8: wild type HSA-DKK2C2 ACE464; Lanes 3 and 9: BKM229; Lanes 4 and 10: BKM228; Lanes 5 and 11: BKM233; Lanes 6 and 12: ACE504. (B) Graphical depiction of the elution profile (absorbance at 280 nm versus time in min) of E. coli derived untagged DKK2C2 (green); wild type HSA-DKK2C2 ACE464 (pink); HSA (red); BKM228 (cyan); ACE504 (blue); BKM229 (purple) and BKM233 (brown) by analytical SEC. The elution profile of molecular weight standards is shown in black. From left to right, the five peaks are 670, 158, 44, 17 and 1.4 kDa. (C) DLS analysis of DKK2C2 variants represented as a linear plot of mutual diffusion coefficient (Dm) versus concentration of DKK2C2. Variants are displayed with different markers: circle is E. coli derived untagged DKK2C2; diamond is HSA; square is wild type HSA-DKK2C2 ACE464; triangle is BKM229; cross is ACE504.

