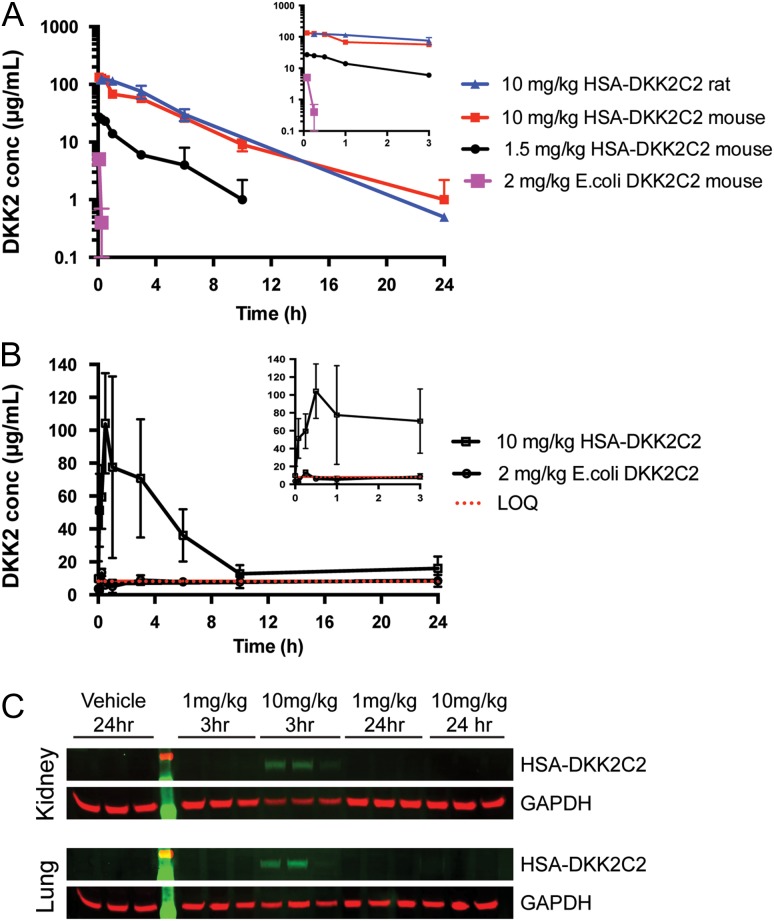
Fig. 2.
PK assessment of untagged DKK2C2 and HSA-DKK2C2. (A) A plasma-drug concentration–time curve from three cohorts of three mice intravenously dosed with 2 mg/kg of E. coli derived DKK2C2, 1.5 or 10 mg/kg of wild-type HSA-DKK2C2 (ACE464). A plasma-drug concentration–time curve for one cohort of three rats intravenously dosed with 10 mg/kg ACE464 is also illustrated. ACE464 was detected by quantitative western blotting, while E. coli derived DKK2C2 was measured by ELISA. (B) A graphical depiction of serum levels of ACE464 and E. coli derived DKK2C2 in mouse samples described in A, as measured by activity in the STF assay. The LOQ of the assay was 8.25 µg/ml (red dashed line). (C) Western blots examining ACE464 in lysates of mouse kidneys (top) and lungs (bottom) 3 or 24 h post intravenous dosing at 1 or 10 mg/kg. GAPDH was considered as a loading control.

