
Figure 1.
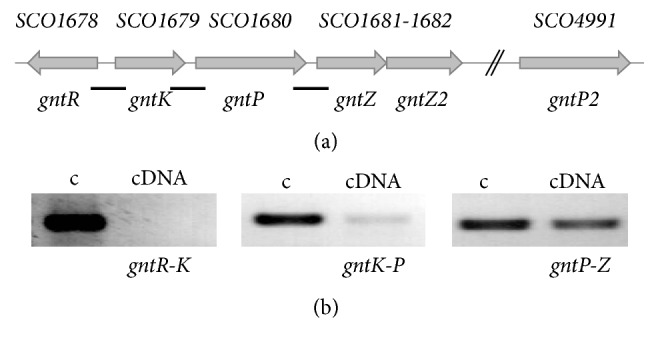
Genes for gluconate operon in S. coelicolor (a) and their transcriptional organization (b). Three black rectangles beneath the SCO genes indicate fragments amplified during RT-PCR analysis of intergenic regions (see (b)).
Official websites use .gov
A
.gov website belongs to an official
government organization in the United States.
Secure .gov websites use HTTPS
A lock (
) or https:// means you've safely
connected to the .gov website. Share sensitive
information only on official, secure websites.
Genes for gluconate operon in S. coelicolor (a) and their transcriptional organization (b). Three black rectangles beneath the SCO genes indicate fragments amplified during RT-PCR analysis of intergenic regions (see (b)).