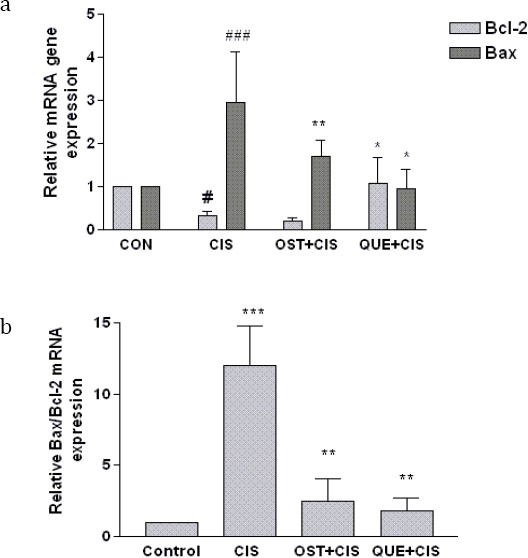
Figure 6.

The effect of querctin (QUE) and osthol (OST) on (a) Bcl2, Bax and (b) Bax/Bcl2 mRNA expression in PC12 cells. Normalization relative to b-actin was performed. Levels of mRNA are expressed relative to control cells in the mean±SEM values derived from three independent experiments. # P-value<0.05, ### P-value<0.001 vs control, * P-value<0.05, ** P-value<0.01 vs cisplatin treated cells
