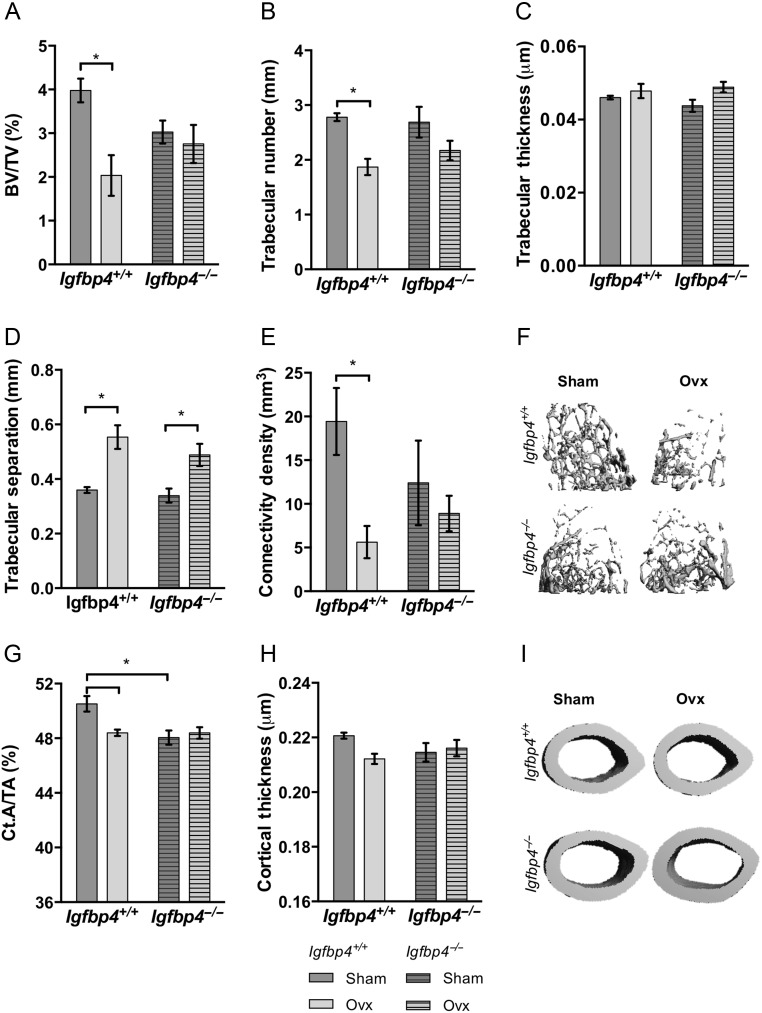
Figure 6.
Femoral architecture upon loss of estrogen. Fixed femurs isolated from 16-week-old ovariectomized or sham-operated mice were analyzed by μCT to examine trabecular (A, B, C, D, E and F) and cortical (G, H and I) microarchitecture. BV/TV, bone volume/total volume; Ct.A/TA, cortical area/total area; OVX, ovariectomized cohort. (n = 5–8/surgery group/genotype, *two-way ANOVA P value <0.05.)

 This work is licensed under a