Fig. 1.

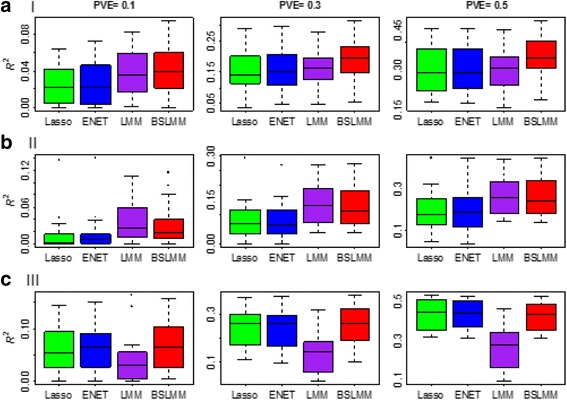
Comparison of the four methods (i.e. Lasso, ENET, LMM and BSLMM) for predicting gene expression in scenarios I-III. a The results of scenario I where the BSLMM modeling assumption is satisfied and 15 causal SNPs are included in the sparse part. b The results of scenario II where the LMM modeling assumption is satisfied. c The results of scenario III where the sparse modeling assumption is satisfied and there are only 15 causal SNPs and the rest are all neutral. The performance is measured by R 2. In each panel from left to right it corresponds to PVE = 0.1, 0.3 or 0.5 respectively
