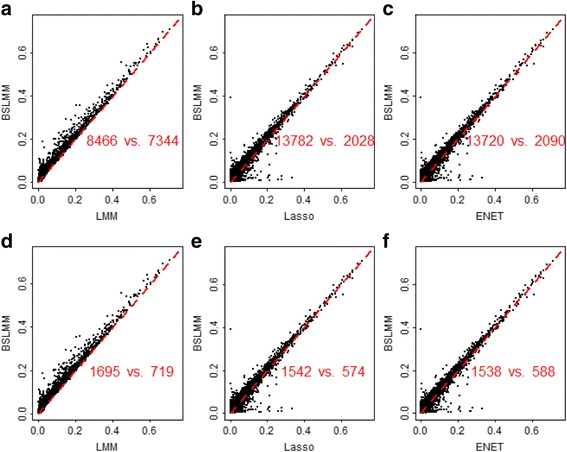
Fig. 2.

Comparison of the prediction performance of the four methods (i.e. Lasso, ENET, LMM and BSLMM) for the Geuvadis data. In each panel it lists the number of genes where BSLMM performs better and the number of genes where BSLMM performs worse; in the top (a)-(c), these numbers are computed across all the genes, and in the bottom (d)-(f) these numbers are computed across only the genes with R 2 ≥ 0.05
