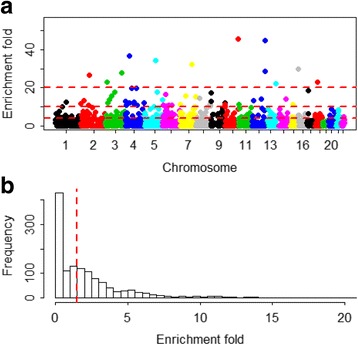
Fig. 4.

Enrichment-fold in 1,324 approximately independent LD blocks. a The enrichment-fold distributed across the chromosomes; the reference lines are 4, 10 and 20, respectively; (b) The histogram of enrichment-fold in 1,324 independent LD blocks; the median is 1.49 (indicating with red reference line) and the maximum is 299.82. The enrichment-fold is computed as the ratio of the proportion of predictive genes (i.e. R 2 ≥ 0.05) and the proportion of the length of that LD block
