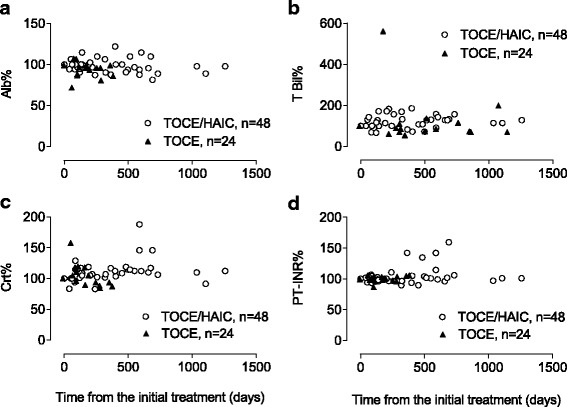
Fig. 4.

Time dependent changes in serum biomarkers. Serum concentrations of (a), albumin (Alb); (b), total bilirubin (T Bil); (c), creatinine (Crt); and (d), prothrombin time-international normalized ratio (PT-INR) are plotted along the course of the treatments. Each value represents a percentage of the serum concentration after treatments versus the value obtained before the initial treatment. The open circles and closed triangles are data from the combination and monotherapy arms, respectively. The number of plotted data in each arm was shown as “n=”
