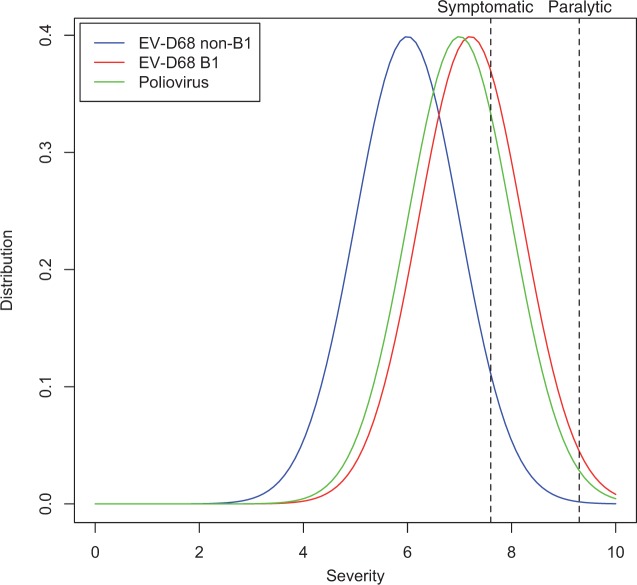
Figure 3.
Conceptual model of enterovirus symptomatic and paralytic symptom distribution. Distributions of disease severity caused by B1, non-B1, and PV isolates are represented by hypothetical curves in red, blue, and green, respectively. For a given isolate lineage, disease severity would be influenced by the genetic background and co-morbidities of the infected individual. Symptomatic (28 percent) and paralytic (1 percent) threshold estimates represented by the black dashed lines are based on the clinical features of PV infections (CDC 2015a). See text for further discussion.

