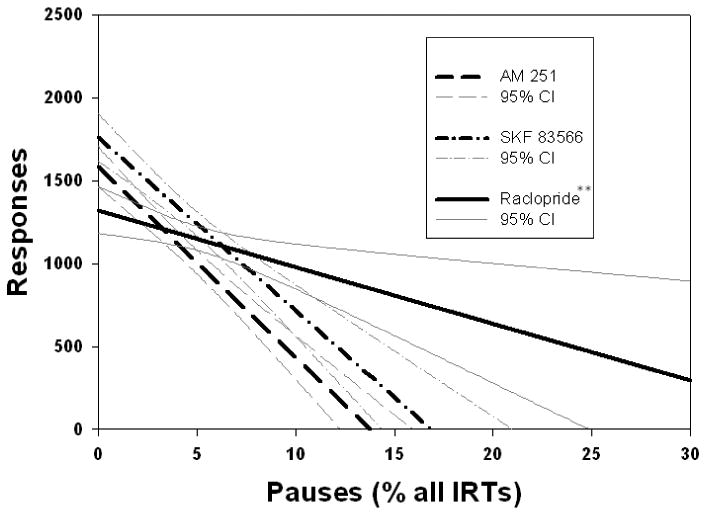
Figure 2.

Least-squares regression lines predicting responding from the percent of IRTs which were pauses (IRTs > 5s). AM 251 and SKF 83566 produced a significantly stronger slope than raclopride. **p < .01 difference between raclopride and both SKF 83566 and AM 251. Regression equations: AM 251: Y = 1582.4 - 114.8 X. SKF 83566: Y = 1683.7 – 86.8 X. Raclopride: Y = 1400.6 – 51.6 X.
