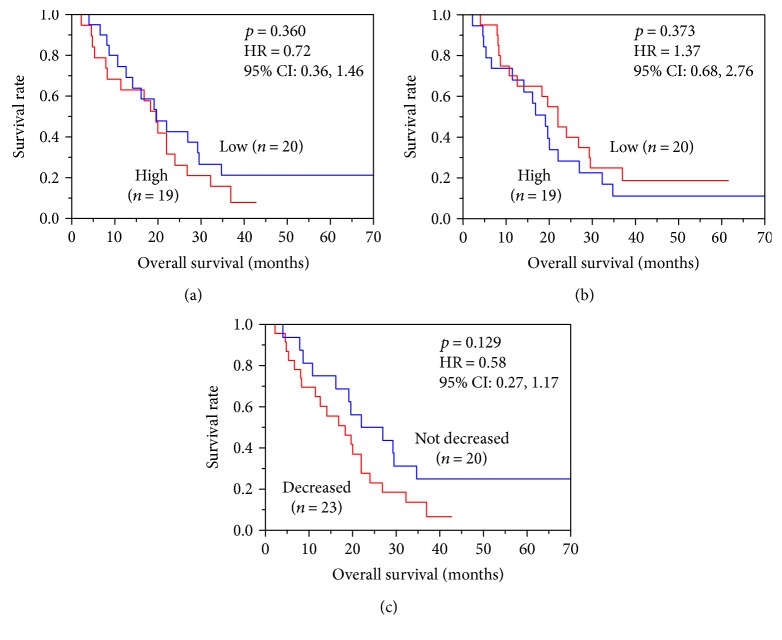
Figure 2.
The relationship between plasma HMGB1 levels and overall survival (OS) was analyzed by Kaplan-Meier plot analysis. Patients (n = 39) were divided into high and low plasma HMGB1 groups based on the (a) pre- and (b) postvaccination levels, and the correlation between these subgroups and OS was analyzed. (c) Patients (n = 39) were also divided into decreased and not-decreased groups based on the changes of plasma HMGB1 between the prevaccination and postvaccination samples, and the relation between these subgroups and OS was plotted.

