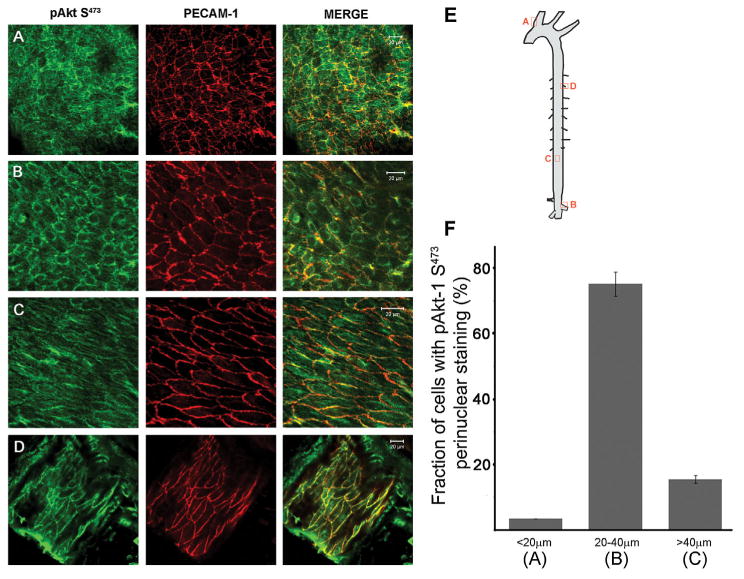
Fig. 1.

Cell morphology and spatiolocalization of phosphorylated Akt-1 in the mouse aorta. En face immunostaining of pAkt-1S473 (green) and PECAM-1 (red) in the brachiocephalic area (A), the renal artery bifurcation (B), the distal part of the descending aorta (C), and the adjacent intercostals artery (D). Scale bar is 20 μm. E: Sites along the aorta where samples were derived. F: Bar graph illustrating the fraction of EC expressing perinuclear pAkt-1S473 staining in regards to cell diameter from areas shown in a, b, and c.
