Figure 6.
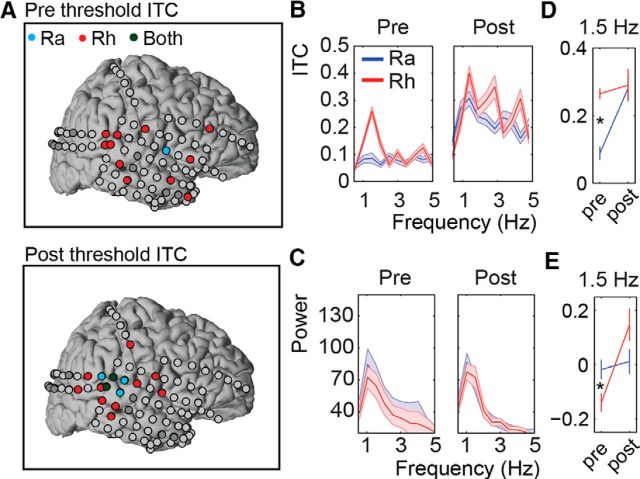
ECoG Results. A, Red, blue, and dark green circles indicate significant ITC for the Rhythmic, Random, or both conditions, respectively. Dark gray electrodes show the electrodes of the seizure onset zone, which were removed from the analysis. Both the prethreshold (left) and postthreshold (right) intervals are shown. B, ITC for the significant ITC channels in the prethreshold (left) and postthreshold intervals (right). C, Power for the significant ITC channels in the prethreshold (left) and postthreshold intervals (right). Shaded areas indicate the SEM over all the significant electrodes. D, ITC at 1.5 Hz. Note that all values are based on the significant ITC prethreshold channels. E, Power at 1.5 Hz for the significant ITC prethreshold channels. Power reflects the relative change to the average of the two conditions and two perception intervals. Asterisks indicate significance at the 0.05 level.

