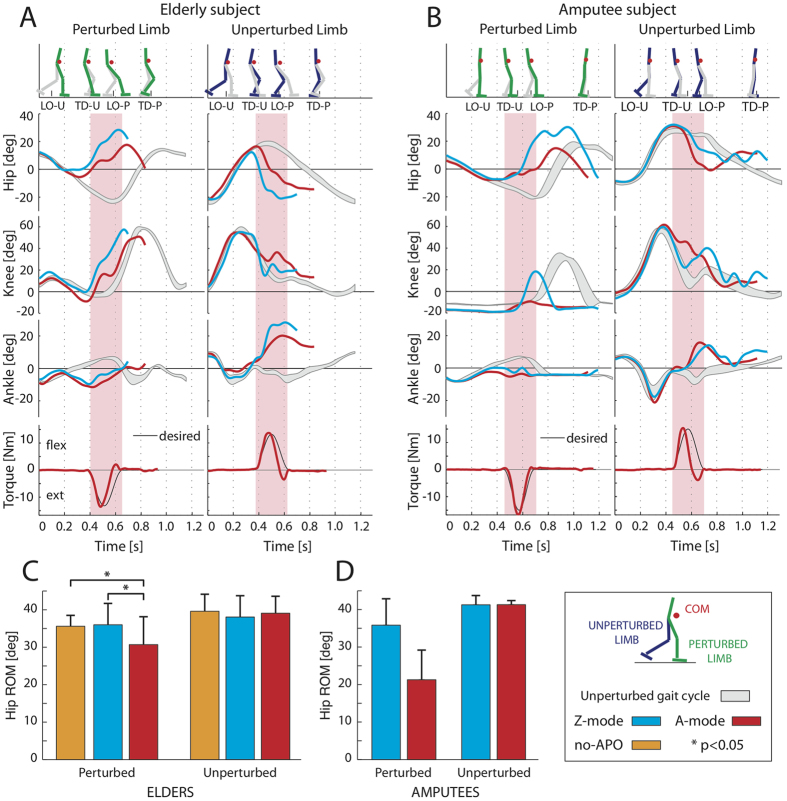
Figure 3. Kinematic patterns at leg joints.
(A and B) Joint angles (hip, knee and ankle) at PL and UL are depicted for three experimental conditions, for one elderly subject and one amputee: i) steady locomotion (mean values ± SD, grey bands); ii) Z-mode (cyan lines); iii) A-mode (red lines). Stick diagrams (on the top; PL and UL are indicated in green and blue, respectively) and APO torques (on the bottom) are shown for the A-mode condition. Pink vertical bands represent the time-intervals corresponding to the enabled assistive torques. (C) The perturbed and unperturbed hip ranges of motion during the no-APO, Z- and A-modes trials (orange, cyan and red bars, respectively) are shown for elderly subjects (mean values ± SD). The label * indicates a significant (p < 0.05) difference among trials. (D) The perturbed and unperturbed hip ranges of motion during the Z- and A-modes trials (cyan and red bars, respectively) are shown for amputee groups (mean values ± SD). The time axes in panels A and B start at the heel strike of the unperturbed gait cycle (grey/shadow area) and at the onset of the perturbed strides (blue and red lines).

