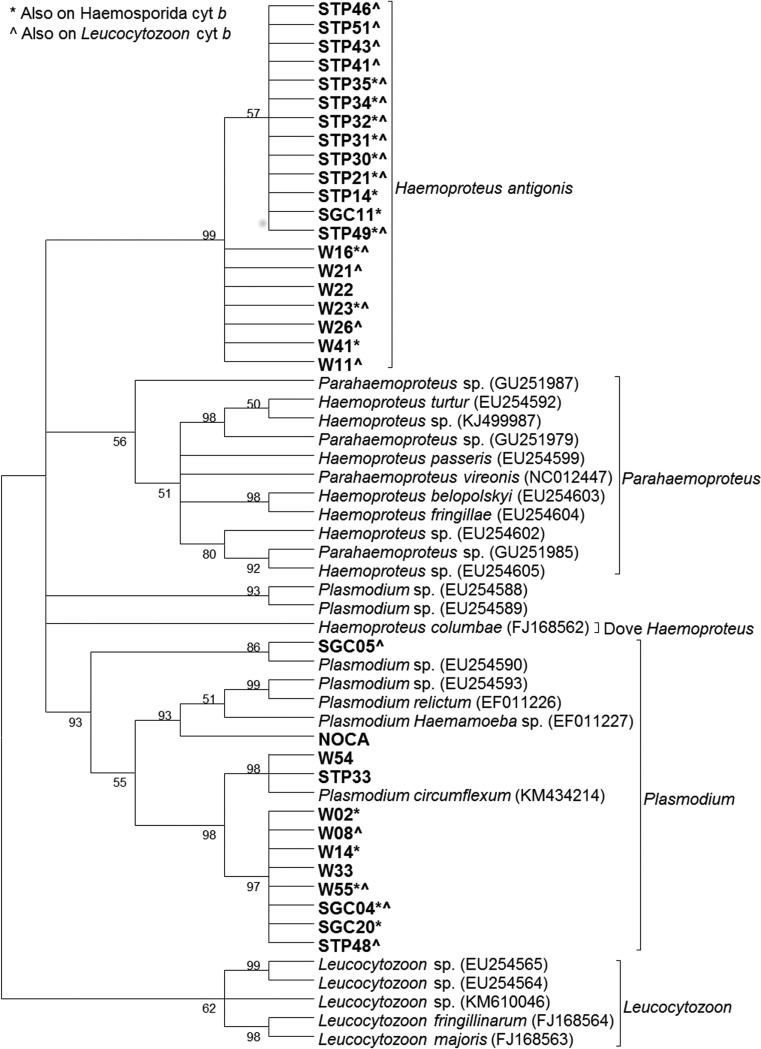
Fig. 3.
Cladogram using avian Haemosporida coI sequences (370 bp). The tree was created using the maximum-likelihood method with a GTR + G model of evolution. Bootstrap values are based on 1000 replicates, and nodes with <50% support are collapsed. Sequences in bold were generated in this study. NOCA – positive control sample from a northern cardinal. W – AWBP whooping crane, STP – sandhill crane harvested in the Texas, SGC – sandhill crane harvested on the Texas Gulf Coast, SNM – sandhill crane harvested in New Mexico.

