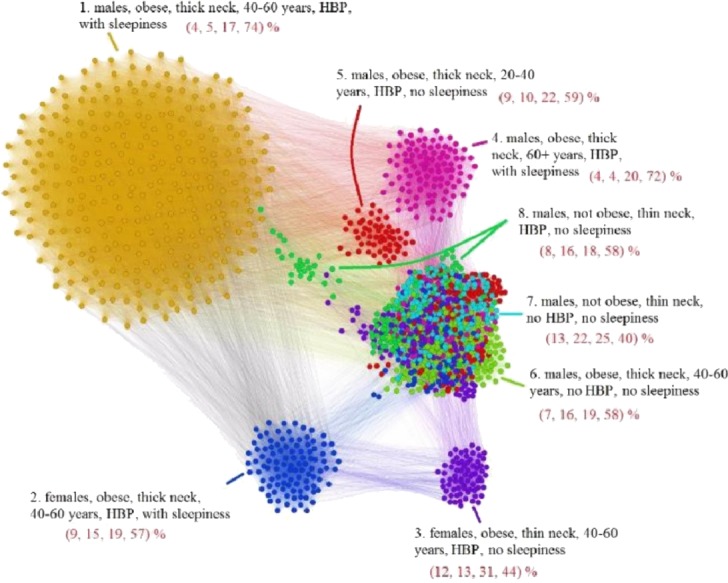
Figure 6. Apnea Patients Network (APN) obtained with data from the Apnea Patients Database (APD), according to the risk factor compatibility relationship, using our dual network clustering methodology (i.e., modularity classes and energy-model layouts).

The assigned colors correspond to modularity classes, and the 8 topological clusters are indicated. For each topological cluster, statistics are provided in red (as percentages) for all AHI risk groups: low, mild, moderate, and severe, using the format (L, Mi, Mo, Se)% (e.g., in Cluster 2 the patients are distributed on risk groups as follows: 9% L, 15% Mi, 19% Mo, 57% Se). The risk group classification is made with AHI values that are obtained by actually performing polysomnography (PSG) and polygraphy.
