. 2017 Jan 20;8(4):2729–2740. doi: 10.1039/c6sc05355f

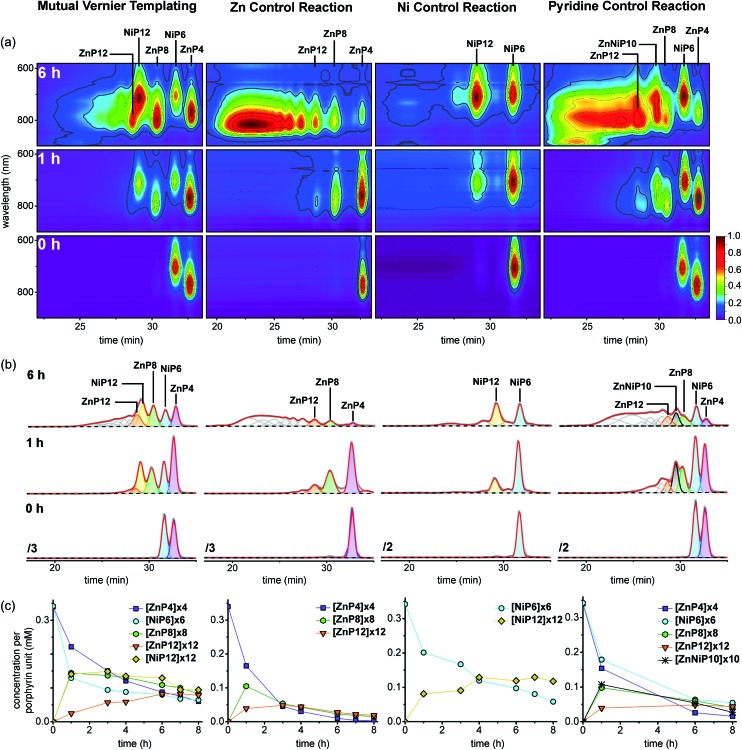
Fig. 12. The outcome of the mutual Vernier templating and three control reactions of the synthesis of NiP12 and ZnP12. (a) The selected deconvoluted GPC traces fitted to Gaussians by Origin® at 0, 1, 4, 6 and 8 h, respectively (THF/1% pyridine, detection at 479 nm where all species have essentially the same absorption coefficient per porphyrin unit). (b) The plots of analytical yields that were calculated by peak fitting of resolved GPC peak areas. (c) The selected 2D-plots at 0, 1, 4, 6 and 8 h, respectively. The intensity was normalized by rainbow colors from purple (lowest) to red (highest). The retention times of all components were calibrated from known compounds, and their identification was based on the calibrated retention time in GPC.

Fig. 12